Yes — truly one command. The recommended way is the install script documented in the Quick Start section:
curl -sSL https://raw.githubusercontent.com/jsuzanne/stigix/main/install.sh | bash
That's it. The script automatically:
- Checks that Docker is installed and running
- Detects your platform (Linux → Host Mode, macOS/Windows → Bridge Mode)
- Asks you to choose a deployment mode (Branch, DC, or both)
- Pulls the
jsuzanne/stigix:stableimage (~500 MB on first run) - Starts all services and auto-generates the default configuration
Dashboard is live at http://localhost:8080 within 30 seconds. Default login: admin / admin — change it immediately after first login.
Windows: The script doesn't run in PowerShell — follow the Windows Installation Guide.
Only two things are strictly required:
- Docker Engine 20.10+ (or Docker Desktop on macOS/Windows)
- 2 GB free RAM minimum — 4 GB recommended for IoT simulation and voice testing
No Python, Node.js, or any other runtime needs to be installed on the host. Everything runs inside the container. The only prerequisite is Docker itself.
Supported platforms: Linux (bare metal, VM, Raspberry Pi 5, Intel NUC), macOS (Apple Silicon and Intel), Windows (via WSL2 + Docker Desktop), AWS EC2 / Azure VM.
Linux (Ubuntu / Debian):
curl -fsSL https://get.docker.com | sh
sudo usermod -aG docker $USER   # then log out and back in
macOS: Download Docker Desktop or OrbStack. Both provide Docker Engine and Docker Compose out of the box.
💡 Pro Tip for Mac users: OrbStack is fully supported and recommended on macOS. It is significantly lighter, faster, consumes much less CPU/RAM, and starts up instantly compared to Docker Desktop.
Windows: Install Docker Desktop with WSL2 backend enabled. This is the recommended path — no manual WSL2 setup needed in recent versions.
Verify Docker is fully operational before installing Stigix:
# 1. Check Docker Engine version (must be 20.10+)
docker --version
# Expected: Docker version 24.x.x, build ...

# 2. Check Docker is running (daemon reachable)
docker info | grep "Server Version"
# Expected: Server Version: 24.x.x
# Error here = Docker daemon not started (open Docker Desktop or: sudo systemctl start docker)

# 3. Check Docker Compose is available (critical for Stigix)
docker compose version
# Expected: Docker Compose version v2.x.x
# If this fails, try the legacy command:
docker-compose version

# 4. Quick smoke test (pull and run a minimal image)
docker run --rm hello-world
# Expected: "Hello from Docker!" message
If all four commands succeed, Docker is ready and you can proceed with the Stigix install command.
Yes. The Stigix image is published for both AMD64 and ARM64. A Raspberry Pi 5 (4 GB RAM) with Ubuntu Server 24.04 is a common and well-tested deployment target for branch lab environments.
A Raspberry Pi 4 (2 GB) works for basic traffic generation and security testing but may run tight if you enable IoT simulation simultaneously. Pi 5 with 4–8 GB is the sweet spot for full-feature lab use.
Docker pulls the correct architecture automatically — no flag needed.
This affects IoT simulation and advanced traffic generation only — for everything else (dashboard, security tests, digital experience probes, convergence tests) both modes work identically.
- Host Mode (Linux only) — The container shares the host network stack directly. Enables full IoT simulation: real DHCP requests, ARP announcements, MAC address spoofing. Required for DHCP fingerprinting demos.
- Bridge Mode (macOS, Windows, WSL2) — Docker uses NAT networking. IoT simulation is limited — devices generate traffic but don't appear as distinct DHCP clients on the physical LAN.
The install script auto-detects your platform and selects the right compose file. On macOS/Windows you can still demo everything except Layer 2 IoT behavior.
Check these three things in order:
# 1. Is the container running at all?
docker ps
# Look for a container named "stigix" with status "Up"

# 2. Check the startup logs
docker compose logs stigix --tail=30
# Look for "Server listening on port 8080"

# 3. Is something else already on port 8080?
sudo lsof -i :8080        # macOS / Linux
netstat -ano | find "8080" # Windows
If port 8080 is taken, add a .env file with PORT=8081 and update the port mapping in docker-compose.yml from "8080:8080" to "8081:8080", then restart.
If docker ps shows the container as Exited, the logs will explain why — most common causes are a missing .env variable or a permissions issue on the config directory.
A lot. On first start, Stigix auto-generates everything it needs with zero manual intervention:
- 67 pre-configured SaaS applications —
config/applications-config.jsonis created automatically with a realistic enterprise mix: Microsoft 365 (Outlook, Teams, SharePoint, OneDrive), Google Workspace, Salesforce, Zoom, Slack, Workday, and more. - Auto-detected network interface —
config/interfaces.txtis populated with your primary interface (eth0,en0,ens4, etc.) detected from the host. - Default admin user —
config/users.jsonis created with a bcrypt-hashedadmin/admincredential.
Services that start active by default:
- ✅ Traffic Generation — begins generating SaaS-like HTTP/HTTPS requests immediately through the detected interface
- ✅ Synthetic Probes (DEM) — starts monitoring a set of default endpoints (Google, Cloudflare, etc.) every 60 seconds
- ✅ Target services — HTTP echo, XFR speedtest, Voice echo, and Convergence SLA probe server are all listening and ready to accept tests from other Stigix nodes
Services that require configuration before starting:
- ⚙️ IoT Simulation — needs a device profile to be loaded first
- ⚙️ Voice Testing — needs a target Stigix node configured
- ⚙️ VyOS Control — needs at least one VyOS router added
In short: open the dashboard and you'll see traffic flowing and probes running within the first minute, with no configuration required.
- Change the password — Go to Settings and update the default
admin/admincredentials immediately. - Set the network interface — In Settings → System Info, under the Network Interfaces section, select the interface the traffic generator should use (e.g.
eth0,enp0s3). Runip addr showon the host if you're unsure which one. Traffic generation won't start without this. - Enable traffic generation — Go to the Dashboard tab and toggle the generator on. The status turns green and the request counter starts climbing within a few seconds.
Everything else (probes, security tests, VyOS routers, API keys) can be configured incrementally as you need each feature.
For most features — no. As long as the host running Stigix has internet connectivity through the SD-WAN path you want to test, traffic generation, security tests, digital experience probes, and convergence tests all work fine.
For IoT simulation in host mode (DHCP fingerprinting), Stigix must be on the same L2 broadcast domain as the SD-WAN router's LAN interface — so the simulated DHCP requests are seen by the router and its IoT classification engine.
A simple and common setup: Stigix runs on a laptop or SBC plugged into the branch LAN behind the SD-WAN router, with a default gateway pointing to the router. That's all you need for a complete lab.
Yes. The install script handles everything — Docker check, platform detection, compose file download, and startup:
curl -sSL https://raw.githubusercontent.com/jsuzanne/stigix/main/install.sh | bash
It auto-detects your platform (native Linux → Host Mode, macOS/WSL2 → Bridge Mode), asks you to choose a deployment mode, pulls the image, and starts the container. Dashboard is live at http://localhost:8080 in under 30 seconds.
You can also bypass the interactive prompt with a flag:
# Source + Target mode (recommended for labs)
curl -sSL .../install.sh | bash -s -- --mode both

# Target only (for DC/hub nodes)
curl -sSL .../install.sh | bash -s -- --mode target

# Dry run (preview without executing)
curl -sSL .../install.sh | bash -s -- --dry-run
Windows users: The install script doesn't run in PowerShell — follow the Windows Installation Guide instead.
Always both, always simultaneously. Every Stigix instance — branch, DC, cloud — is a sender and a responder at the same time. This is not a mode you configure; it is the fundamental architecture of the platform.
Concretely, every running instance:
- Sends — generates SaaS traffic, runs security tests, fires DEM probes, measures convergence, sends voice streams
- Responds — listens for incoming voice echo, convergence probes, XFR speedtest, and HTTP health requests from any other Stigix node
This means you can point any branch node at a DC node and run tests immediately — without touching any configuration on the DC side. The responder services start automatically.
In practice, a node deployed centrally (DC or cloud) will be used mostly as a responder because branch nodes send their tests toward it. But it is still fully capable of generating traffic outbound if needed. There is no "responder-only" mode to configure — that's just how you use it.
The install script's --mode both/source/target flag simply controls which ancillary services are included in the Docker compose file — it does not change the core sender+responder behaviour of the container itself.
Yes — all configuration and logs live in Docker named volumes (stigix_config and stigix_logs), which persist independently of the container lifecycle. Pulling a new image and restarting does not touch your data.
Stigix also supports State Persistence for running services. In Settings → System Info, each service (Traffic, Probes, IoT, Voice) has a toggle. When enabled, the service resumes exactly its pre-restart state automatically — so if traffic generation was running before a restart, it comes back running without manual intervention.
Default states: Traffic ON, Probes ON, IoT OFF (requires config), Voice OFF (requires server).
Proxmox LXC containers restrict low-level network operations by default. Stigix needs NET_ADMIN and NET_RAW Linux capabilities for Scapy-based IoT/Voice simulation (raw socket access for DHCP, ARP, and RTP injection).
Add these capabilities to your docker-compose.yml:
services:
  stigix:
    cap_add:
      - NET_ADMIN
      - NET_RAW
For a trusted lab environment where isolation is less of a concern, you can also use:
privileged: true
Warning: privileged: true gives the container full host access — only use it in isolated lab setups, never in production or shared environments.
Three quick checks in order:
# 1. Container status — look for (healthy)
docker compose ps
# Expected: stigix ... Up N minutes (healthy) ... 0.0.0.0:8080->8080/tcp

# 2. Health API endpoint
curl http://localhost:8080/api/health
# Expected: {"status":"healthy","version":"1.x.x"}

# 3. Interactive CLI (optional deeper check)
docker exec -it stigix stigix-cli
# Then run: auth login → admin/admin → status
You can also confirm auto-generated config was created:
# 67 applications should be listed
jq '.applications | length' config/applications-config.json
# Expected output: 67

# Auto-detected network interface
cat config/interfaces.txt
If the health endpoint returns 200 and the container is marked (healthy), everything is running correctly.
The Traffic Generator creates continuous background HTTP/HTTPS traffic simulating realistic enterprise user activity — Microsoft 365, Google Workspace, Zoom, Salesforce, Slack, etc. It is designed to populate SD-WAN flow tables and trigger application-aware routing decisions.
Security Testing is entirely separate: it fires on-demand or scheduled one-shot requests to known malicious or policy-test URLs to validate that your security policies enforce correctly. The two engines use different config files, ports, and log files and run independently.
Feature          Traffic Generator     Security Tests
Purpose          Simulate user load    Validate security policy
Source config    applications-config   security-profile.json
Execution        Continuous loop       On-demand / scheduled
Log file         traffic.log           test-results.jsonl
Stats            stats.json            Dashboard history
Weights are relative, not absolute percentages. The probability of an app being selected is app_weight / total_weight_of_all_apps.
{ "domain": "google.com",    "weight": 100 }  → 50% (100/200)
{ "domain": "microsoft.com", "weight":  50 }  → 25%
{ "domain": "zoom.us",       "weight":  50 }  → 25%
The dashboard UI automatically recalculates and displays percentages as you edit weights. Useful ranges: 1–25 for background apps, 51–100 for regular business apps, 100–200 for dominant/demo apps (e.g. video streaming).
Prefix the domain with http:// to force plain HTTP (useful for internal servers). The engine uses HTTPS by default for all other entries.
{ "domain": "http://192.168.203.100", "weight": 50,
  "endpoint": "/cgi-bin/hw.sh", "category": "Internal" }
You can also use raw IP addresses with HTTPS as long as the target serves a valid certificate. Multiple entries for the same domain with different endpoints are fully supported to distribute load across API paths.
Traffic profiles are stored in config/applications-config.json. Go to Settings → Traffic Distribution and use the Export button (top-right) to download the full JSON file. To import it on another Stigix instance, click the Import button next to it — no restart required.
For CLI-based workflows, the Stigix CLI supports profile management:
stigix-cli profile export --output my-profile.json
stigix-cli profile import --file my-profile.json
Profiles are self-contained JSON files that travel easily between lab, PoC, and demo environments.
Three methods to confirm live traffic:
- Dashboard counters — the Traffic tab shows total requests sent, success rate, and per-app breakdown in real time.
- Log file —
cat logs/traffic.log | tail -fstreams live request outcomes. - Stats JSON —
cat logs/stats.json | jq '.requests_by_app'shows actual distribution vs configured weights.
If the counters are frozen, verify that traffic generation is toggled on in the dashboard, the correct network interface is selected, and the container is running (docker ps).
Start with the pre-built Enterprise Profile template available in Settings. It includes Microsoft 365 (Outlook, Teams, SharePoint, OneDrive), Google Workspace, Zoom, Salesforce, Slack, and Workday with realistic weights.
Recommended weight tiers for enterprise demos:
- 100–150 — Primary apps: Outlook, Teams, Zoom
- 60–90 — Regular apps: Salesforce, Google Workspace
- 20–50 — Secondary: Slack, Dropbox, ServiceNow
- 5–15 — Background: update servers, telemetry endpoints
Consumer or shadow IT profiles (streaming, gaming, social media) use weights of 150–200 to dominate the mix and clearly show QoS and policy impact on the SD-WAN flow table.
Stigix supports 7 probe types, each using the native OS binary for accuracy:
- HTTP / HTTPS — Uses
curlto measure DNS lookup, TCP handshake, TLS handshake, and TTFB separately. Best for SaaS app health. - PING (ICMP) — Uses native
pingfor round-trip time. Score 100 if <100ms, reaches 0 at 500ms. - DNS — Uses
dig(bypasses OS cache) to measure raw nameserver resolution. Score 100 if <80ms, reaches 0 at 400ms. - TCP — Uses
nc(netcat) to test port reachability and handshake timing. - UDP — Uses
iperf3 -uto measure jitter and packet loss. Score =100 - (loss% × 10) - jitter_penalty. 10% loss = score 0. - CLOUD — Hits the Stigix Cloudflare Worker with full
curltelemetry (DNS/TCP/TLS/TTFB). Timeout 15s.
Default polling frequency depends on the probe type: HTTP, HTTPS, and Cloud probes default to 300 seconds (5 min); PING, TCP, UDP, and DNS probes default to 60 seconds. All are configurable from 30s to 3600s per probe. HTTP/HTTPS probes use a longer default because they run up to two sequential curl calls (timing metrics + optional content match body), and a shorter frequency can cause queue congestion when many probes are active simultaneously.
Navigate to Settings → Synthetic Probes → Add New Probe (or click Configure New Probe in the Digital Experience tab). Fill in:
- Name — Uppercase label, e.g.
HQ-GATEWAYorOFFICE365-UDP - Protocol — HTTP, HTTPS, PING, TCP, DNS, UDP, or CLOUD
- Target — FQDN (
google.com), socket (1.1.1.1:53), or IP - Timeout — 1000ms to 60000ms (default 5000ms)
- Frequency — 30s to 3600s (default 60s)
Probes start running immediately after saving — no restart needed. The probe appears in the Digital Experience dashboard within one polling cycle.
To monitor an internal server with plain HTTP: set type to HTTP and target to http://192.168.1.10 (with explicit protocol prefix).
All probes return a score from 0 to 100. The dashboard stores minimum, maximum, and average over time.
Score    Rating     Meaning
80–100   Excellent  No user impact
50–79    Fair       Noticeable latency / jitter
1–49     Poor       Severe degradation
0        Critical   Unreachable or HTTP 5xx
HTTP/HTTPS scoring: 100 - (30% × latency_penalty + 35% × TTFB_penalty + 25% × TLS_penalty). Heavily penalised if latency >2s, TTFB >1s, or TLS >800ms.
An endpoint transitions to FLAKY when it fails but recently succeeded, and to DOWN after multiple consecutive failures — helping distinguish transient blips from hard outages.
Cloud probes target the Stigix Cloudflare Worker infrastructure and are available to all deployments without any configuration. Unlike custom probes (which you define against your own endpoints), Cloud probes hit Stigix-managed infrastructure on shared global POPs. They simulate specific scenarios useful for SD-WAN and SASE validation:
- Info / Egress (
/saas/info) — Returns your public IP, country, and Cloudflare POP. Essential to prove which SASE egress point is in use and that traffic is flowing through the expected tunnel. - Slow SaaS (
/saas/slow) — Simulates a 5-second backend delay. Score 100 if <200ms, 0 at 5s. Ideal for demonstrating latency impact of sub-optimal path selection. - Flap (Square Wave) (
/saas/flap) — Alternates between 0s and 5s delay every 60 seconds. Creates a square-wave pattern in your probe graph — useful for validating alerting thresholds and showing the dashboard reacting to periodic SaaS degradation. - Wave (Sine) (
/saas/wave) — Smoothly oscillates latency up to 5s over a 2-minute sine cycle. Produces a characteristic wave curve in the timing graph, useful for validating gradual path quality detection. - Random Latency (
/saas/random) — 50% chance of a 5-second delay on each request. Simulates unpredictable SaaS degradation to validate that your SD-WAN path selection reacts to intermittent rather than sustained issues. - Large Download (
/download/large) — Downloads a 10 MB payload and scores on throughput. Score 100 if completed in <1s, 0 at 10s. Validates that the active WAN path delivers adequate bandwidth for bulk transfers. - Security EICAR (
/security/eicar) — Delivers the EICAR test string to check that IPS / Threat Prevention is blocking malware signatures on the active path.
Advanced Stigix Probe — A builder option at the bottom of the dropdown lets you configure a fully custom cloud probe with granular parameters (mode, delay value, custom headers). Useful for scripting specific latency thresholds for a particular customer scenario.
All Cloud probes use the same curl-based engine as HTTPS probes, providing a full 4-layer timing breakdown (DNS, TCP, TLS, TTFB) visible in the Timing Analysis modal. They require a valid Stigix Key to authenticate against the Cloudflare Worker.
Probe configurations are stored in config/connectivity-config.json. Export the file using the Export button in the top-right toolbar of the Active Monitoring Probes section, or copy it directly from the config volume.
To import on a new instance: click the Import button (also in the top-right toolbar, next to Export) and upload the JSON file. The backend picks it up immediately — no restart needed.
For multisite PoCs, keeping a library of probe config files (one per customer vertical — retail, hospital, manufacturing) makes it trivial to load the right set of probes before a demo.
The top banner of the Digital Experience view contains three key sections:
- Global Experience — A single score (0–100) averaged across all active probes. This is the headline KPI to show on a dashboard during a PoC. It reflects the overall quality of reachability as seen from the Stigix machine through the SASE/SD-WAN path.
- Score Trend — A time-series chart of the global score over the selected window (16M, 1H, 6H, 24H, 7D). The dashed green line marks the maximum observed score and the dashed red line the minimum, giving a quick visual of score stability. Use this to show a "before/after" when switching WAN paths or enabling a policy.
- Flaky Probes — Lists probes whose recent results oscillate between success and failure. A probe becomes Flaky when it fails after previously succeeding, and moves to Down after multiple consecutive failures. This panel surfaces intermittent issues that would be invisible in simple up/down monitoring.
Below the banner, Performance Trends by Type shows one mini-chart per probe protocol (HTTP/HTTPS, PING, DNS, UDP, STIGIX CLOUD). Each card displays the aggregate score, average latency, and success rate for that protocol family — useful to identify whether a degradation is protocol-specific (e.g. only UDP/voice paths are affected) or global.
The main Active Monitoring Probes table lists every probe with its last score, sparkline history, average latency range, and a reliability badge (percentage of successful polls). Click any probe row to open its detailed modal with timing breakdown and recent captures.
HTTP, HTTPS, and STIGIX CLOUD probes use curl to decompose each request into four distinct timing phases, shown as a stacked area chart in the Probe Performance modal:
- DNS — Time to resolve the hostname into an IP address. Should be <15ms on a healthy path. High DNS times indicate the SD-WAN DNS proxy or the upstream resolver is slow — common when SASE inspection intercepts DNS before forwarding to the resolver.
- TCP — Time to complete the TCP three-way handshake after DNS. Reflects raw network RTT to the server. Ideally <10ms for LAN targets, <50ms for cloud SaaS via a well-placed PoP. A sudden increase signals WAN congestion or a route change.
- TLS — Time to complete the TLS handshake (certificate exchange, cipher negotiation) on top of the TCP connection. This is the most sensitive indicator of SASE inspection overhead: deep TLS inspection (SSL decryption) adds 10–80ms depending on policy complexity. A consistently high TLS value with a normal TCP value is a strong indicator that TLS inspection is active on that path.
- TTFB — Time to First Byte: the delay between the end of the TLS handshake and receiving the first byte of the HTTP response. This reflects backend application response time. A high TTFB with normal DNS/TCP/TLS means the application server is slow, not the network path — useful for isolating whether a degradation is network-side or application-side.
Total latency = DNS + TCP + TLS + TTFB
Example (Google Search, healthy path):
  DNS  7.7ms  TCP  4.5ms  TLS 24ms  TTFB 35ms  → Total 76ms
The Score Trend sub-chart within the probe modal shows score (solid line) and total latency (dashed orange line) on the same axis, making it easy to correlate score drops with latency spikes. The Recent Captures table gives the raw numbers for every poll cycle, including the IP address served — which changes when Anycast CDN load-balances or when a failover switches the egress PoP.
Prisma SD-WAN probes are a special probe category automatically discovered from the Prisma SD-WAN / Strata Cloud Manager API. Unlike custom probes that you create manually, these are synthesised directly from Prisma's own Application Probe Kit (APK) monitoring data — meaning the probe endpoints and types mirror what your SD-WAN already measures natively.
How auto-discovery works:
- Stigix calls the Prisma SD-WAN API (using the credentials in
PRISMA_SDWAN_CLIENT_ID/CLIENT_SECRET/TSGID) to pull the list of monitored application probes from all branch sites. - Each discovered probe is imported with
source: "discovery"and displayed with a shield icon badge in the probe table, distinguishing it from user-created probes. - Results are polled on the same schedule as other probes and stored in the same history database — enabling side-by-side comparison between Stigix-measured experience and Prisma-measured experience for the same endpoints.
Filtering Prisma SD-WAN probes: In the Digital Experience tab, use the PRISMA SDWAN filter button in the top toolbar to isolate only auto-discovered probes. This is useful in multi-site deployments where you have dozens of probes and want to focus on the Prisma-native view.
Stale badge: If the Prisma API has not returned updated data for a probe within the expected refresh window, the badge turns orange and displays STALE — signalling that the API sync may have a problem (expired token, region mismatch, or network issue between Stigix and the Prisma cloud).
Requirements: Prisma SD-WAN probe discovery requires valid API credentials and the Prisma SASE API feature to be enabled in Settings → Prisma SASE API. The API uses OAuth2 client credentials — refer to the Settings & API FAQ for the exact setup steps.
Content matching is an optional feature for HTTP and HTTPS probes that verifies the response body contains (or does not contain) a specific text string. It is disabled by default — all existing probes continue to work exactly as before unless you explicitly enable it.
How to configure it:
- Open Settings → Synthetic Probes and click Add New Probe (or the edit icon on an existing HTTP/HTTPS probe).
- At the bottom of the form, check Enable content matching.
- Choose the Match mode:
contains— probe succeeds only if the response body includes the expected text.not_contains— probe succeeds only if the expected text is absent from the body (useful to detect error pages, maintenance banners, or deprecated API responses).
- Enter the Expected text (plain text, max 80 characters). Optionally enable Case sensitive.
How it works under the hood: After the normal HTTP request (which measures DNS/TCP/TLS/TTFB), a second bounded request fetches the body (capped at 10 KB, 3 s timeout). The normal timing metrics are never affected — they come from the first curl call. The body fetch only adds ~50–200 ms per polling cycle, only for probes where it is enabled.
Result fields added to each probe capture:
content_match_enabled  true / false
content_match_mode     contains | not_contains
content_match_value    expected text (truncated to 80 chars in logs)
content_match_result   "matched" | "text not found" | "text unexpectedly found"
                       | "body empty" | "fetch error"
content_match_ok       true | false
When content_match_ok is false, the probe score is forced to 0 and the status becomes unreachable — it will appear in the Flaky / Down panels and the Match column in Recent Captures will show ✗ with the failure reason.
Backward compatibility: Probes without a content_match block behave exactly as today — the feature is completely opt-in. Existing JSON configs and API responses are not changed.
Typical use cases:
- Verify a corporate portal returns
"Welcome"instead of a redirect to a login page. - Confirm an internal health API returns
"healthy"or"ok". - Detect a maintenance page using
not_containson"Under maintenance". - Check that a Prisma-inspected SaaS endpoint still returns expected content after an SSL decryption policy change.
Four distinct policy enforcement areas:
- URL Filtering — Sends HTTP GET requests to test URLs (e.g.
urlfiltering.paloaltonetworks.com/test-malware-domains). A blocked response (redirect to block page, HTTP 403, or connection reset) = policy working. - DNS Security — Resolves malicious test domains via
dig. NXDOMAIN or a sinkhole IP = policy working. Live resolution = bypassed. - Threat Prevention / EICAR — Attempts to download the EICAR test file from configurable targets. Download blocked = IPS working.
- C2 / AI Security — Advanced scenarios testing C2 beaconing patterns and AI application policy enforcement.
When SSL Forward Proxy Decryption is active on Prisma Access or a Next-Gen Firewall, the firewall intercepts HTTPS connections and re-encrypts the session using its own Forward Trust CA. Without this CA certificate, HTTPS threat tests (EICAR, URL Filtering, DLP) and synthetic SaaS probes will abort with TLS handshake errors before reaching the security inspection engine.
Stigix provides native, automated certificate management:
- ⚡ 1-Click Auto-Import — In Settings ➔ Prisma SASE API, click Auto-Import from Prisma SASE. Stigix connects to your tenant's SSE API, extracts
Forward-Trust-CA(RSA/ECDSA) andRoot CA, and builds the trusted bundle. - 📁 Manual Upload — You can upload custom
.crt/.pemfiles or paste PEM text for custom enterprise PKIs (e.g. Active Directory CS). - 🌐 Zero-Touch Mesh Sync — Importing the CA on the Leader automatically distributes it across all remote mesh spoke nodes (DC1, BR1, BR2, BR5, BR8) via Mesh Provisioning.
- Runtime Injection — The CA bundle is automatically injected into Node.js (
NODE_EXTRA_CA_CERTS), Python (REQUESTS_CA_BUNDLE,SSL_CERT_FILE), and subprocesses (CURL_CA_BUNDLE). - 🔄 URL Filtering HTTP / HTTPS Toggle — In Security Testing, the URL Filtering toolbar features an instant
[ 🌐 HTTP | 🔒 HTTPS ]switch. In HTTPS mode, Stigix automatically convertshttp://URLs tohttps://, demonstrating that the firewall decrypts TLS sessions and enforces category-based URL filtering on encrypted traffic.
Security tests are driven by a vendor-agnostic profile JSON (config/security-profile.json). You can swap the entire test set by loading a different profile, each targeting the correct test infrastructure for that vendor.
Three ways to switch profiles:
- UI Import — Security tab → Security Profile → Import Profile → upload your JSON
- API —
POST /api/security/profilewith a JWT and the JSON body - Direct file edit — replace
config/security-profile.json; read on every request, no restart needed
Example Fortinet profile structure:
{ "vendor": "fortinet",
  "url_filtering": { "items": [
    { "id": "malicious", "name": "Malicious",
      "url": "https://www.eicar.org/download/eicar.com.txt" }
  ]},
  "dns_security": { "items": [
    { "id": "botnet", "name": "Botnet C2",
      "domain": "botnet.test.fortiguard.com", "category": "basic" }
  ]}
}
The most common causes in order of frequency:
- Traffic not routed through Prisma Access — The Stigix container is sending directly to the internet without going through a GlobalProtect tunnel or IPsec connection. Check your network path.
- Security policies not applied to the right zone — The test traffic may be hitting a rule that allows everything. Verify the source zone matches your SASE policy.
- Wrong vendor profile — If you loaded a Palo Alto profile but are testing a Fortinet deployment, the test URLs will not match FortiGuard's category database and may be allowed by default.
- Local DNS resolution — For DNS tests, your stub resolver may bypass the SASE DNS security enforcement. Ensure the container uses the SASE-provided DNS server.
Each test type (URL, DNS, Threat, C2, AI) has its own independent scheduler. When enabled, tests run automatically in the background after the configured interval — no need to click "Run All".
Recommended intervals by use case:
- Live demo — Manual run only (click "Run All Enabled"). Avoid scheduled runs during demos to control timing.
- PoC — 30–60 minutes. Provides fresh results without hammering the network.
- Continuous monitoring — 60–120 minutes. Lightweight background validation.
The scheduler persists across container restarts. Results accumulate in logs/test-results.jsonl and are displayed in the results table with timestamps.
Yes. Every URL, DNS, and EICAR target row has an individual Play ▶ button that runs just that single test in isolation — without affecting other targets or the scheduler. This is useful for:
- Demonstrating a single blocked category live during a meeting
- Troubleshooting why one specific domain behaves differently
- Testing a freshly-added custom URL before running the full suite
There is also a Copy 📋 button on each EICAR target row that copies the equivalent curl command so you can run the test manually from any terminal.
EDL (External Dynamic List) testing lets you validate that your firewall or SD-WAN gateway correctly blocks traffic matching bulk threat intelligence lists — IPs, URLs, and domains — at scale, without manually crafting individual test cases.
Three list types supported:
- IP EDL — validates blocking of malicious IPv4, IPv6, and CIDR ranges. Each entry is tested via
pingtoward the target IP. A blocked response (timeout or ICMP unreachable from the firewall) = policy working. - URL EDL — validates blocking of fully-qualified URLs. Each entry is tested via
curl. A redirect to a block page or HTTP 403 = URL filtering enforced. - DNS EDL — validates blocking of domains (FQDNs). Each entry is resolved via
nslookup/dig. AnNXDOMAINor sinkhole IP response = DNS Security enforced.
Loading your lists:
- Remote Sync — paste a public URL (e.g. a GitHub raw file, a Palo Alto EDL feed, or any plain-text threat intel list) and click Sync. Stigix downloads and parses the file automatically, stripping comments and blank lines, and deduplicates entries.
- Manual Upload — upload a local
.txtor.csvfile with one entry per line.
Test modes:
- Sequential — tests entries from the top of the list up to the configured limit. Useful for ordered lists where priority entries come first.
- Random — picks a random sample from the entire list. Useful for large lists (thousands of IPs) where full sequential testing would take too long.
A Max Elements / Run cap prevents overloading the firewall or saturating the network during bulk tests. Each element test has a strict timeout (2–10s depending on type).
Results: A mini summary table shows the last 5 results inline per list type. Full results (pass/fail per entry, latency, timestamp) are stored in the Test Results history tab and are queryable via the CLI or MCP Server.
Stigix uses XFR (eXpress Flow Reporter) as its bandwidth testing engine instead of the commonly used iperf3. This was a deliberate choice driven by three key limitations of iperf3 in SD-WAN validation contexts:
- Fixed source port support: XFR lets you explicitly bind to a specific source port (called the Client Flow Port) before the test starts. This is essential in SD-WAN environments — you can filter Prisma SD-WAN or firewall flow logs by that exact port and instantly correlate the test traffic to a specific path, queue, and policy. iperf3 uses ephemeral ports by default, making flow traceability unreliable.
- Real-time JSON streaming telemetry: XFR streams results as a continuous JSON feed during the test — not just a summary at the end. Stigix reads this live stream and plots throughput (Mbps), RTT (ms), TCP retransmits, and UDP packet loss in real time on the dashboard graph. With iperf3 you get a text report at the end, not a live display.
- Richer interval metrics: XFR reports TCP window fluctuations, retransmit counts, and dropped packet percentage at every interval. iperf3 in server mode provides only aggregate data, making it harder to spot micro-congestion events during the test.
The result is a speedtest that feels more like a live network monitoring tool: you see the throughput curve evolve in real time, can spot congestion spikes as they happen, and can immediately cross-reference the traffic in your SD-WAN analytics portal using the pinned source port.
XFR is open-source: github.com/lance0/xfr
The XFR test panel in Stigix exposes the full engine capability set:
Protocols:
- TCP — with congestion control algorithm selection (Cubic, BBR, Reno). Useful for comparing SD-WAN path behavior under TCP-sensitive traffic like file transfers or backup.
- UDP — fixed bitrate UDP flood. Shows packet loss and jitter, relevant for media and real-time traffic simulation.
- QUIC — tests HTTP/3 style transport, increasingly relevant for SaaS and cloud application paths.
Directions:
- Upload (client → server) — tests outbound path from source node
- Download / Reverse (server → client) — tests inbound path
- Bidirectional — simultaneous upload + download, stresses full-duplex path
Advanced options:
- Bitrate cap — set a target Mbps limit, or leave at
0to detect peak throughput - Duration — test duration in seconds (server enforces a maximum via
XFR_MAX_DURATION) - Client Flow Port — pin the source port for deterministic flow identification in Prisma SD-WAN / firewall logs
- DSCP / TOS marking — stamp QoS marking (e.g. EF, CS1, decimal, hex) on the test flow to validate SD-WAN path prioritization
🔑 Deterministic source port — automatic flow traceability:
For UDP and QUIC tests, Stigix automatically derives a deterministic source port from the test sequence number so every run is identifiable in SD-WAN flow logs without any manual configuration:
XFR-0007 (UDP/QUIC) → source port 40007  (range 40000–49999)
XFR-0123 (UDP/QUIC) → source port 40123
For TCP tests the source port is ephemeral by default — use the Client Flow Port field to pin it manually if you want to track a TCP speedtest in Prisma flow logs. For UDP/QUIC you can also override the auto-derived port by setting a custom Client Flow Port.
Tests can be launched from the Speedtest tab in the dashboard, via the CLI (speedtest start --target <name>), or via the MCP Server ("Run a 30-second TCP speedtest between BR8 and DC1").
As soon as the test starts, Stigix connects to the XFR JSON stream endpoint (/api/tests/xfr/:id/stream) and renders a live graph. The metrics displayed depend on the protocol:
TCP tests:
- Throughput (Mbps) — plotted every interval as a real-time curve
- RTT (ms) — round-trip time measured at each interval
- TCP Retransmits — overlaid on the throughput graph; spikes indicate congestion or path instability
- TCP Window — send window fluctuation, shows receiver buffer pressure
UDP / QUIC tests:
- Throughput (Mbps)
- Packet loss (%) — per-interval loss rate, critical for voice/video path validation
- Jitter (ms)
All data is streamed in real time — there is no waiting until the end of the test to see results. When the test completes, the final summary (total bytes transferred, average throughput, peak RTT, total retransmits) is stored in the history and is queryable via CLI or MCP.
XFR uses a dedicated port separate from the Stigix management port. The default configuration:
- Port:
9000TCP/UDP (configurable viaXFR_PORTin.envor docker-compose) - Direction: the source node initiates the test connection to the target node on this port
- Inbound rule required: the target node must accept inbound TCP/UDP on port
9000from the source node's IP
Firewall checklist:
- Target node: allow inbound
TCP 9000andUDP 9000from all Stigix source IPs - Source node: allow outbound to target's
TCP/UDP 9000(usually open by default) - For bidirectional tests: both nodes act as source and target simultaneously — open port 9000 inbound on both
Rate limiting and abuse protection: The server side enforces hard limits via environment variables:
XFR_MAX_DURATION— maximum test duration in seconds the server will accept (default: 3600). The server severs the connection if the client requests longer.XFR_RATE_LIMIT— max number of concurrent active tests (default: 2). Additional requests are queued.XFR_ALLOW_CIDR— IP whitelist for incoming test connections (default:0.0.0.0/0= all). Restrict to your lab CIDR for tighter security.
The IoT engine uses Scapy to craft and inject raw network frames at Layer 2/3. It simulates full device lifecycle: DHCP discovery/request/ACK (with vendor-specific option 55 fingerprints), ARP announcements, and application-level traffic — making simulated devices indistinguishable from real hardware to the network.
This is important for Palo Alto IoT Security demos: the DHCP fingerprint triggers the classification engine, which correlates MAC OUI, DHCP option strings, and traffic patterns to identify device type and assign a trust score.
App traffic (the Traffic Generator) produces standard HTTP flows from the Stigix container itself. IoT Simulation creates distinct virtual MAC addresses for each simulated device, making each appear as a separate endpoint on the network. This enables:
- IoT device visibility and classification in NGFW/IoT Security dashboards
- Segmentation policy validation (can a simulated camera reach the internet?)
- OT/IoT-specific behavior like Modbus, MQTT, BACNET patterns
- Bad-behavior scenarios: beaconing, DNS floods, port scans, data exfiltration
- Python generator — Fast, deterministic, offline. Use it when you need a standard set of devices quickly (cameras, printers, HVAC, smart plugs) and reproducibility matters.
- LLM-based generation — Use it when you need a customer-specific or industry-specific device set. You provide a natural-language prompt (e.g. "generate 20 devices for a hospital: patient monitors, infusion pumps, smart beds, radiology scanners") and the output is a ready-to-use JSON device profile.
Pre-built vertical examples are available for: healthcare, manufacturing, utilities/SCADA, retail, and smart office. These can be loaded directly without any LLM call.
No — the host OS matters significantly:
- Linux (bare metal or VM) — Full host-mode simulation with real DHCP, ARP, and virtual MAC addresses. Recommended for lab environments and PoCs.
- macOS / Windows / WSL2 — Bridge-mode only. DHCP fingerprinting and ARP are limited by Docker networking restrictions. The devices will generate traffic but won't appear as distinct DHCP clients on the physical network.
For maximum realism in a DHCP fingerprinting demo, a Linux host is required. A lightweight Alpine or Ubuntu VM on the same physical segment works well.
The Import button in the IoT Simulation toolbar offers three different import paths, each suited to a different situation:
🔒 Stigix JSON Config — Restores a full IoT simulation environment from a previously exported .json file.
- Use when: moving a lab between sites, sharing a ready-made device scenario with a colleague, or restoring a known-good configuration after testing.
- The file must have been exported from Stigix's own Export JSON button — it contains the full device list with all fields (MAC, hostname, protocols, bad behavior, intervals, etc.).
- Supports Merge mode (append to existing devices) or Replace mode (overwrite everything).
📄 Device Security Assets — Imports devices from a Palo Alto IoT Security / Prisma Access inventory CSV (one row per device).
- Use when: the customer already has Palo Alto IoT Security deployed and you want to simulate their exact real-world device population — real MACs, hostnames, vendor profiles, and observed protocols.
- Stigix extracts OS-aware DHCP fingerprints (Windows, iOS, Linux, medical devices, FortiOS, macOS), uses the
display_apps/Applicationscolumn for realistic protocol mix, and appliesml_risk_level(Critical/High) to automatically enable bad behavior on risky devices. - Options: Max Devices (top N by risk), IoT-only filter (
profile_vertical == IoT, excludes PCs/VMs/tablets), Security percentage (force bad behavior on a fixed % of devices).
How to export from Prisma Access:
- Log into Prisma Access → IoT Security → Devices
- Optionally filter by Risk Level (Critical / High) or Profile Vertical (IoT)
- Click Export → CSV and save locally
- In Stigix: IoT Simulation → Import → Device Security Assets → drop the CSV
Key CSV columns used: hostname, mac address, profile, profile_vertical, ml_risk_level, display_apps, vendor. The output uses real MAC addresses from the CSV, so PAN IoT Security will recognise the same DHCP fingerprints it originally classified.
⚠️ Vulnerability Report — Imports from a Palo Alto CVE/Vulnerability export (one row per CVE per device) — the richest threat intelligence source.
- Use when: you want to demonstrate how real CVEs, APT group attributions, and ICS-CERT alerts translate directly into simulated attack behaviors on specific devices.
- Stigix aggregates all CVE rows per device (grouped by MAC), computes a Danger Score, and maps threat signals to specific attack behaviors.
How to export from Prisma Access:
- Log into Prisma Access → IoT Security → Vulnerabilities
- Optionally filter by Severity (Critical / High), Site, or Vertical
- Click Export → CSV and save locally
- In Stigix: IoT Simulation → Import → Vulnerability Report (orange icon) → drop the CSV
Key CSV columns used: Device Name, MAC Address, CVE, CVSS, Severity, ICS-Cert, APT Names, Risk Score, Site Name, OS.
Danger Score = Risk Score (0-100)
             + Critical CVEs × 15  +  High CVEs × 8  +  Medium CVEs × 3
             + APT Groups    ×  5  +  ICS-CERT  × 10  +  Max CVSS  × 2
Threat-aware bad behavior (Auto mode): APT groups → beacon | ICS-CERT → port_scan | Critical/High CVEs → pan_test_domains
You can also override Auto mode with: All devices, Percentage (random N%), or None (import clean, no attack simulation).
Which export to use? Use Device Inventory for a broad realistic device population. Use Vulnerability Report for executive-level security demos that show specific CVEs, APT attribution, and risk scoring — far more impactful.
When Bad Behavior is enabled on a device, it generates traffic matching known attack profiles — designed to be detected by Palo Alto IoT Security, DNS Security, and URL Filtering. Multiple behaviors can run simultaneously as parallel threads on the same device.
Available attack patterns:
- PAN Test Domains (
pan_test_domains) — 2 DNS queries to official Palo Alto test domains + 1 HTTPS/HTTP SYN, every 90s. Guaranteed detection by PAN-OS — ideal for policy validation demos. - C2 Beacon (
beacon) — 1 DNS + 1 TCP SYN to a fake Command & Control domain, every 45s. Simulates realistic APT heartbeat traffic. - DNS Flood (
dns_flood) — Burst of 3 DNS queries to suspicious domains, every 60s. Simulates compromised device calling home repeatedly. - Port Scan (
port_scan) — TCP SYN to 10 common ports on a random target, every 120s. Simulates OT lateral movement (common in ICS-CERT scenarios). - Data Exfiltration (
data_exfil) — 2 large TCP uploads (1400-byte payloads) to external IPs, every 90s. Simulates bulk data theft. - Random (
random) — Picks one of the above at random per cycle (every 20–60s). Useful for background noise simulation.
All attack traffic is generated using Scapy raw sockets (Layer 2/3), so it appears as genuine network traffic to firewalls, NGFW flow analyzers, and IoT Security classifiers — not as application-layer HTTP from the container itself.
The intervals were tuned to avoid Python D-state accumulation under concurrent device load while still producing detectable attack patterns. You can combine multiple behaviors on the same device (e.g. ["beacon", "port_scan"]) to simulate a fully compromised APT device.
Each simulated IoT device runs via Scapy raw sockets inside a single Python process. Running too many concurrently causes threads to enter Python D-state (uninterruptible I/O wait), which starves the CPU scheduler and breaks latency-sensitive services like VoIP:
163 devices active:  CPU ~100%, 5+ D-state threads, VoIP loss 37-73% ❌
 30 devices active:  CPU ~18%,  0  D-state threads, VoIP loss 0%     ✅
Stigix uses a semaphore queue: only maxConcurrentDevices devices run Scapy at any time. The rest rotate through a queue. Each device has four states:
- 🟢 ACTIVE — Scapy running, consuming a concurrency slot
- 🟡 QUEUED — Waiting for a free slot, will activate automatically
- 🔵 IDLE — Cycle complete, sleeping
traffic_intervalseconds before re-queuing - ⚫ Stopped — Manually removed from rotation
Tuning from the UI: The IoT Concurrency Control slider at the top of the IoT tab lets you set the limit live — no restart needed. Raising it promotes QUEUED devices to ACTIVE immediately; lowering it lets ACTIVE devices finish their current cycle gracefully before releasing slots.
The System Health mini-panel shows CPU%, UDP errors/s, and Python D-state count in real time. When D-state ≥ 3 or CPU > 80%, lower the concurrency slider to protect VoIP simulation quality.
The default (30 devices) is a good starting point for most lab machines. On a Raspberry Pi 5 (4 GB RAM), 20–25 is safer. On a server-class Intel NUC or VM with 4+ vCPUs, 40–50 is usually fine.
The traffic_interval field controls the full duty cycle of a device. It sets both how long the device is ACTIVE (sending Scapy traffic) and how long it is IDLE (sleeping) between cycles:
Phase    Duration              What happens
ACTIVE   traffic_interval (s)  Scapy runs: DHCP, ARP, protocols, bad behavior
IDLE     traffic_interval (s)  Device sleeps — no packets sent
Full cycle  2 × traffic_interval   Before the device can run again
Example with interval = 180s: the device is active for 3 minutes, then idle for 3 minutes (total 6-minute cycle). This is deliberately realistic — real IoT devices (cameras, sensors, HVAC) operate in bursts then sleep, not continuously.
Queue wait time with many devices:
Avg cycle  ≈ 2 × 180s = 360s
Slot rate  = 30 slots / 360s ≈ 1 slot every 12s
Queue wait ≈ (N − 30) × 12s  (e.g. 100 devices → 14 min)
The interval is set per-device in the Edit modal, in the JSON (traffic_interval field), or assigned randomly between 60–300s at import time. A value of 60s gives high-frequency traffic; 300s gives sparse, realistic background traffic.
Yes — by default, simulated devices reclaim the same IP after a container restart. Stigix implements RFC 2131 INIT-REBOOT: when a device wakes up, it sends a single DHCP REQUEST for its last known IP (stored in config/dhcp_leases.json) instead of starting a full Discover cycle:
First boot:   DISCOVER → OFFER → REQUEST → ACK  (full cycle, ~4s)
Restart:      REQUEST (INIT-REBOOT, requested_addr = last IP) → ACK  (<1s)
              — no DISCOVER, no OFFER needed
The lease file maps each MAC to its last IP and gateway. It lives in the persistent Docker volume (./config/), so it survives container restarts and image upgrades.
Fallback scenarios:
- Server NAKs (IP taken or subnet changed) → automatic fallback to full DISCOVER
- No response to INIT-REBOOT (server timeout) → automatic fallback to full DISCOVER
- First boot, no saved lease → normal DISCOVER flow
- DHCP fails completely → device stays silent, lease not erased (retried on next boot)
This is exactly how real IoT devices behave when waking from sleep. It also means your SD-WAN policy and IoT Security visibility rules don't need to be re-applied after a lab restart — the same IP/MAC pair reappears immediately.
The Python generator (generate_iot_devices.py) includes 13 device categories, 50+ vendors, and 200+ device models with pre-built realistic DHCP fingerprints. It runs offline in under 1 second and requires no API key.
Device categories:
- Security Cameras (Hikvision, Axis, Dahua, Bosch, Hanwha)
- Smart Lighting (Philips Hue, LIFX, Lutron, Legrand)
- Environmental Sensors (temperature, humidity, CO2 — Honeywell, Bosch, Siemens)
- Smart Plugs & Power (TP-Link Kasa, Belkin WeMo, Shelly)
- HVAC / Building Automation (Carrier, Trane, Daikin, Ecobee)
- Medical Devices (Philips infusion pumps, Baxter, Fresenius — with Enea OSE DHCP fingerprints)
- Industrial / SCADA (Rockwell Allen-Bradley, Siemens S7, ABB)
- Retail / POS (Ingenico, Verifone, NCR terminals)
- Network Infrastructure (Cisco AP, Aruba, Meraki)
- Printers (HP, Xerox, Brother, Ricoh)
- Smart TVs & AV (Samsung, LG, Sony, Crestron)
- Voice Assistants (Amazon Echo, Google Nest)
- Wearables & Tracking (GPS trackers, badge readers)
Supported protocols per device: dhcp, arp, lldp, http, https, rtsp (cameras), cloud (heartbeat to vendor FQDN), mqtt (telemetry), dns, ntp, modbus (SCADA), bacnet (building automation).
Pre-built presets:
python iot/generate_iot_devices.py --preset small      # 30 devices
python iot/generate_iot_devices.py --preset medium     # 65 devices
python iot/generate_iot_devices.py --preset large      # 110 devices
python iot/generate_iot_devices.py --preset enterprise # 170 devices

# Custom mix for a hospital scenario:
python iot/generate_iot_devices.py --custom "Medical Devices:15,Security Cameras:10,HVAC:5"
For industry-specific device mixes with customer context (realistic names, descriptions, narratives), use the LLM-based generation method instead — pre-built vertical examples are available for healthcare, manufacturing, utilities/SCADA, retail, and smart office.
Voice Testing generates bidirectional RTP-style UDP streams between the Stigix instance and a configured target (usually another Stigix node or any iperf3 server). It measures:
- Jitter — Variation in packet arrival timing (ms)
- Packet Loss — Percentage of UDP packets lost in each direction
- Latency — Round-trip time (ms)
- R-Value — ITU-T E-model call quality score (0–93)
- MOS — Mean Opinion Score (1–5), the industry standard for perceived voice quality
Results are shown per call session and plotted over time in the Voice dashboard.
🔑 Deterministic source port — built-in flow traceability: Each RTP call uses a source port derived from its internal CALL-ID. This is embedded in the UDP payload and mapped deterministically:
CALL-0001 → UDP source port 31001
CALL-0015 → UDP source port 31015  (range 31000–31999)
This means you can filter your SD-WAN Orchestrator or Prisma SD-WAN flow browser by src-port 31015 to instantly isolate which tunnels and circuits a specific call traversed. The CALL-ID is also embedded in the RTP payload itself, so the echo server on the remote side can decode and log which call it is echoing back.
Basic failover observation (e.g. watching ping stop and resume) tells you that a failover happened. The Convergence Lab tells you how bad it was:
- Blackout window — Exact number of milliseconds of zero traffic in each direction
- Directional loss — Uplink and downlink packet loss measured independently (failover is rarely symmetric)
- Recovery profile — How quickly each direction returns to baseline after the path change
Each test receives a unique ID (e.g. CONV-0042) and is logged to logs/convergence-history.jsonl for audit and comparison. If Prisma SD-WAN API credentials are configured, the active egress path (e.g. BR8-INET2 → DC2-INET) is automatically enriched 60 seconds after the test completes.
🔑 Deterministic source port — exact flow correlation: Each convergence probe uses a UDP source port derived from its test number. The sequence number and a high-resolution timestamp are embedded in the UDP payload itself:
CONV-0001 → UDP source port 30001
CONV-0042 → UDP source port 30042  (range 30000–39999)
You can filter your SD-WAN Orchestrator flow browser by udp src-port 30042 to see exactly which WAN tunnel carried each probe packet during the failover window. This makes it possible to prove, with flow-level evidence, which circuit was active when the blackout occurred.
- Voice Testing — When the customer wants to see the practical impact of latency and jitter on call quality. MOS numbers are immediately understandable to non-technical stakeholders ("MOS dropped from 4.2 to 2.1 during the outage").
- Convergence Lab — When the customer wants a precise, quantified proof of failover speed. Useful for SLA discussions and SD-WAN competitive evaluations ("failover completed in 380ms, zero uplink loss, 2% downlink loss during the switchover").
For maximum impact, combine both: run a voice session continuously, trigger a failover (manually or via VyOS impairment), and show how the Convergence Lab captures the exact outage window that correlates with the MOS dip in the Voice dashboard.
During an SD-WAN tunnel switchover or circuit degradation, the Failover 2.0 engine breaks down the event into an explicit chronological stepper progression:
- T0 (Initial / Pre-Failover Path): The baseline egress path (e.g.
BR8-MPLS → DC2-MPLS) active before impairment injection. - T1 (Failover Transition & Outage): The transition phase where packet drops or latency spikes occur, displaying the exact blackout duration (in ms) and packet loss percentage.
- T2 (Stabilized Backup Path): The newly selected SD-WAN path (e.g.
BR8-INET2 → DC2-INET) once convergence is complete.
Each step displays explicit transition deltas and duration badges, eliminating ambiguous static timestamps and providing irrefutable proof of SD-WAN steering behavior.
In Failover 2.0, convergence tests persist their full time-series metrics natively in logs/convergence-history.jsonl:
- Dual-Metric Graphs: Plots latency (ms) and packet loss (%) concurrently on synchronized SVG curves.
- Adaptive Y-Axis Scaling: The loss graph dynamically scales its vertical axis (0–5%, 0–25%, 0–100%) so small micro-burst packet loss spikes (e.g. 0.8%) remain clearly visible rather than flattened at the bottom.
- Interactive Time Scrubber & Zoom: Drag the time scrubber across the test timeline or click instant zoom presets (
1m,5m,15m,ALL) to inspect microsecond-level failover characteristics.
Clicking any past test in the Failover Test History opens the Test Details & Analysis Drawer. Inside the drawer, click the Export PoC Card (PNG) button:
- Generates a pixel-perfect, high-resolution dark-mode summary card rendered directly from the DOM using HTML5 canvas.
- Includes test ID, target name, timestamp, probe frequency (e.g. 1000 PPS), blackout outage duration, directional packet loss, and full multi-path sequence progression.
- Instantly downloads as a standalone PNG image file ready to embed into executive PoC reports, customer deliverables, and architecture validation decks.
Because Stigix embeds deterministic source ports (30000 + TestID) in every convergence probe, the backend can query the Prisma SD-WAN / Strata Cloud Manager Flow API to discover exactly which WAN circuit carried each packet:
- Live SD-WAN Path Inspection: Clicking the live path button queries Prisma SD-WAN in real time to resolve the active ingress and egress interfaces.
- On-Demand Historical Path Refresh: If a test was run before SCM flows were indexed or if the lookback window expired, an on-demand Re-query SCM Path button re-executes the API search across a 240-minute window without rerunning the test.
VyOS Control is a subsystem that automates network-level impairment injection on VyOS routers via the VyOS HTTP API. It allows you to programmatically simulate real-world network degradation scenarios without touching router configs manually.
Capabilities:
- SET-QOS — Apply latency (ms), packet loss (%), and rate-limiting (Mbps) on any interface
- CLEAR-QOS — Remove all impairments and restore clean forwarding
- Sequences — Chain multiple actions with time offsets (T+0, T+10, T+30 minutes) to simulate realistic link degradation and recovery scenarios
- Cyclic loops — Repeat a sequence automatically every N minutes (e.g. every 60 minutes for persistent demo environments)
- Audit trail — Every action is logged with a unique Run ID (
SEQ-xxxxorMAN-xxxx), timestamp, duration, and parameters
Requirements:
- VyOS 1.3+ with the HTTPS API service enabled
- An API key configured on the router
- Network reachability from the Stigix container to the router management IP
Minimal VyOS configuration:
set service https api keys id MY-KEY key 'YOUR-API-KEY-HERE'
set service https api-restrict virtual-host vyos.lab
commit
save
Then add the router in VyOS Control → Routers → Add Router with the management IP and API key. Stigix will automatically discover all interfaces and their descriptions (e.g. "Paris to NYC MPLS"), which are promoted throughout the UI for easy identification.
Go to VyOS Control → Sequences → New Sequence. A sequence is a list of timestamped actions:
T+0  min  →  SET-QOS  eth1  latency=50ms  loss=0%   (degradation starts)
T+5  min  →  SET-QOS  eth1  latency=200ms loss=5%   (brownout)
T+10 min  →  CLEAR-QOS eth1                          (recovery)
T+15 min  →  SET-QOS  eth0  latency=30ms  loss=2%   (failover path now degraded)
T+20 min  →  CLEAR-QOS eth0                          (full recovery)
Key rules:
- Offsets are clamped to the cycle duration — if you reduce a 60-minute cycle to 30 minutes, any offset >30 is automatically clamped to 30.
- Run IDs are unique per execution:
SEQ-0042for automatic cyclic runs,MAN-0007for manual triggers. This allows you to correlate impairment events with convergence test results and voice MOS dips.
This error means the vyos-http-api service has entered an unstable state — usually after a period of uptime or a partial configuration change. The config on the router is fine; the API daemon needs a restart.
Resolution steps:
# 1. Verify the API config is still correct
show configuration commands | match 'service https'

# 2. Restart the HTTP-API service (fastest fix)
sudo systemctl restart vyos-http-api.service

# 3. Verify it came back up
show log | match 'vyos-http-api'
# Expected: "Configuration success" + "Serving on http://localhost:8080"
If the API config itself has stale entries (e.g. an old key ID), clean them up in configuration mode before restarting:
configure
delete service https api keys id OLD-KEY-ID
commit
save
exit
Yes. When the Stigix MCP Server is configured with Claude Desktop, you can issue plain-English commands like:
- "Add 200ms latency and 3% packet loss on the MPLS link of BR8"
- "Simulate a brownout on eth1 of router Paris-R1 for 5 minutes then clear"
- "Run the failover demo sequence on loop every 30 minutes"
The MCP server translates these into the VyOS API sequence lifecycle automatically: creates a temporary ad-hoc sequence, executes it immediately (MAN-xxxx run ID), retrieves the CLI equivalent for confirmation, and cleans up the temp sequence. See MCP_SERVER.md for setup instructions.
Step 1 — Create a Service Account in Strata Cloud Manager:
- Log in to Prisma Access / Strata Cloud Manager (or Prisma SASE portal).
- Navigate to Settings → Service Accounts.
- Create a Service Account and note the TSG ID (Tenant Service Group ID), Client ID, and Client Secret.
- Assign minimum required permissions:
prisma-sdwan-config.readandprisma-sdwan-monitor.read.
Step 2 — Configure directly in the Web UI (Recommended):
The fastest and easiest way to configure credentials is directly through the Stigix Dashboard without editing any files:
- Open the Stigix dashboard and navigate to Settings → Prisma SASE API Integration.
- Enter your Tenant Service Group ID (TSG ID), Client ID, and Client Secret.
- Ensure the Enabled toggle is turned on.
- Click Test Auth — Stigix immediately performs an OAuth2 token exchange with Palo Alto Networks Strata Cloud Manager and validates API reachability.
- Click Save Configuration. The credentials are encrypted and stored in the persistent volume (
./config/) and take effect immediately with no container restart required.
Alternative — Environment Variables (Headless / CI/CD):
For automated or headless deployments, you can also inject them via .env or docker-compose.yml:
PRISMA_SDWAN_CLIENT_ID="abc@123.iam.panserviceaccount.com"
PRISMA_SDWAN_CLIENT_SECRET="your-client-secret"
PRISMA_SDWAN_TSG_ID="1234567890"

# Optional
PRISMA_SDWAN_REGION="de"     # de, us, uk, etc.
PRISMA_SDWAN_CACHE_TTL=600   # Cache in seconds (default 10 min)
DEBUG=true                   # Verbose API logs in docker compose logs
Features unlocked once configured:
- Site Auto-Detection: Automatic site badge and tenant identification in the dashboard header.
- Smart Target Selector: Convergence targets auto-populated from DC LAN interfaces.
- Egress Path Enrichment: Active SD-WAN path displayed in convergence history (e.g.
BR8-INET2 → DC2-INET). - Interactive VPN Topology: Real-time tunnel health and SD-WAN underlay chassis visualization.
- Flow Search & Diagnostics: Real-time
getflowpath analysis and SLA verification.
Key environment variables for the all-in-one container:
JWT_SECRET="change-me-in-production"   # Auth token secret (required)
ADMIN_PASSWORD="your-password"         # Dashboard login password
PORT=8080                              # Web UI port (default 8080)

# Stigix Cloud / Registry
STIGIX_TARGET_BASE_URL=https://...     # Override Cloud Worker URL
STIGIX_TARGET_MASTER_KEY="..."        # Key for advanced Cloud Worker features
STIGIX_TARGET_SHARED_KEY="..."        # Signing key for authenticated Cloud probes

# Network
NETWORK_INTERFACE=eth0                 # Interface for traffic generation
All variables can be set in .env at the project root or directly in docker-compose.yml under the environment: section. Changes take effect after container restart.
Stigix Targets are remote endpoints that host the Stigix agent services (voice, convergence, XFR, security, connectivity). Add them in Settings → Stigix Targets using the Add Stigix Target button:
- Name — Friendly label (e.g. "DC1-Paris", "Hetzner-DE")
- Host — IP or FQDN of the remote agent
- Capabilities — Select which tests this target supports: Voice, Convergence, XFR, Security, Connectivity
- Ports — Override default ports if needed (voice: 6100, convergence: 6101, HTTP: 8082)
Targets can also be auto-discovered via the Stigix Registry (Hybrid Registry feature) — remote agents register themselves automatically, and the dashboard shows them as "Discovered" with their last-seen timestamp. This simplifies multi-site deployments significantly.
The backend exposes a full REST API on the same port as the UI (default 8080). All protected endpoints require a JWT token.
Authenticate:
curl -X POST http://<HOST>:8080/api/auth/login \
  -H "Content-Type: application/json" \
  -d '{"password": "your-password"}'
# Returns: { "token": "eyJ..." }
Common API calls:
# Get current status
curl http://<HOST>:8080/api/status \
  -H "Authorization: Bearer <TOKEN>"

# Run all enabled security tests
curl -X POST http://<HOST>:8080/api/security/run \
  -H "Authorization: Bearer <TOKEN>"

# Import a security profile
curl -X POST http://<HOST>:8080/api/security/profile \
  -H "Authorization: Bearer <TOKEN>" \
  -H "Content-Type: application/json" \
  -d @my-profile.json
Full API reference is available in docs/API_REFERENCE.md. The Stigix CLI wraps all common API calls for convenience.
The MCP (Model Context Protocol) server lets Claude Desktop control Stigix via natural language. Setup in claude_desktop_config.json:
{
  "mcpServers": {
    "stigix": {
      "command": "python3",
      "args": ["/path/to/stigix/mcp-server/src/server.py"],
      "env": {
        "STIGIX_URL": "http://<HOST>:8080",
        "STIGIX_TOKEN": "your-jwt-token"
      }
    }
  }
}
Once configured, you can control Stigix entirely from Claude Desktop: run security tests, trigger VyOS impairments, query probe status, manage traffic profiles, and more — all in plain English. See MCP_SERVER.md for the full tool catalog.
With the Stigix MCP Server connected to Claude Desktop, you can interact with your lab mesh using conversational English:
- "Start generating 500 pps of traffic across all finance applications on BR1"
- "Run a security posture validation test and summarize any bypassed URL or DNS categories"
- "Inject 150ms latency on the MPLS link between BR2 and DC1"
- "Check the health and p95 latency of our Custom TCP ERP application"
Claude discovers available tools, maps intent to REST endpoints across any node in the mesh, and returns structured markdown tables and executive summaries.
To prevent accidental network outages, the MCP server enforces a Propose & Confirm safety flow for all VyOS actions:
- When asked to impair a link, Claude calls
get_vyos_interfacesto inspect the router topology and filters out management interfaces. - Claude presents the resolved router name, interface (e.g.
eth1), IP subnet, and proposed action to you in the chat. - Claude explicitly requests your confirmation ("Please confirm if you want me to apply 150ms latency on VyOS-DC1 eth1").
- Only after you reply "Yes" or "Confirm" does Claude execute
vyos_execute_actionto apply the change.
In Settings → MCP Server, a real-time interaction feed provides full transparency into Claude Desktop activities:
- Live Pulse & Tool History: Shows every tool call in real time with category icons, node badges, and execution duration mini-bars (green < 500ms, amber < 2s, red > 2s).
- Server-Side Audit Logging: Every action is transparently logged server-side to
logs/mcp-history.jsonlwith timestamps, tool parameters, and response status codes.
⚠️ Beta feature — under active development. The Topology view is already useful but will gain new capabilities in upcoming releases.
The Topology tab provides a live visual map of your Prisma SD-WAN fabric directly in the Stigix dashboard — without having to navigate the Prisma Orchestrator UI. It shows:
- VPN Overlay view — logical SD-WAN paths between sites, with tunnel health status:
ACTIVE(routing traffic),BACKUP(usable but idle), orDOWN(link failure) - Physical view — underlay connectivity showing local WAN interfaces, their termination points, and resolved peer device names (e.g.
DC1-R1) - HUB filter — toggle to isolate tunnels connected to Data Centers or Branch Gateways, hiding standard branch-to-branch mesh links for clarity
This is particularly powerful during failover demos: as you trigger a VyOS impairment or physically disconnect a link, the Topology view updates in real time to reflect which tunnels went DOWN and which BACKUP path became ACTIVE.
Current scope: The Topology view currently covers Prisma SD-WAN only (ION devices, VPN links, WAN circuits). A Prisma Access / ZTNA overlay is not yet implemented.
The Topology view queries the Prisma SD-WAN API directly. It requires Prisma SD-WAN service account credentials:
PRISMA_SDWAN_CLIENT_ID— your service account Client IDPRISMA_SDWAN_CLIENT_SECRET— the corresponding secretPRISMA_SDWAN_TSGID— your Tenant Service Group ID (TSG ID)PRISMA_SDWAN_REGION— your tenant region (e.g.Germany,US)
The easiest way to enter credentials is via the UI — no file editing needed:
- Go to Settings → Prisma SASE API
- Fill in the Client ID, Client Secret, TSG ID, and Region fields
- Click Save & Test — a green checkmark confirms the API connection is working
Once credentials are saved, the Topology tab becomes active and data is fetched automatically. The system also uses these credentials for Flow Search (getflow), Convergence path enrichment, and Cloud Autodiscovery.
Important: These are Prisma SD-WAN credentials (service account from the Prisma SD-WAN Orchestrator). A regular Prisma Access admin account will not work — the API uses OAuth2 client credentials with SD-WAN-specific scopes.
The Physical Underlay View renders active VyOS backbone routers as realistic physical network chassis nodes on an interactive canvas:
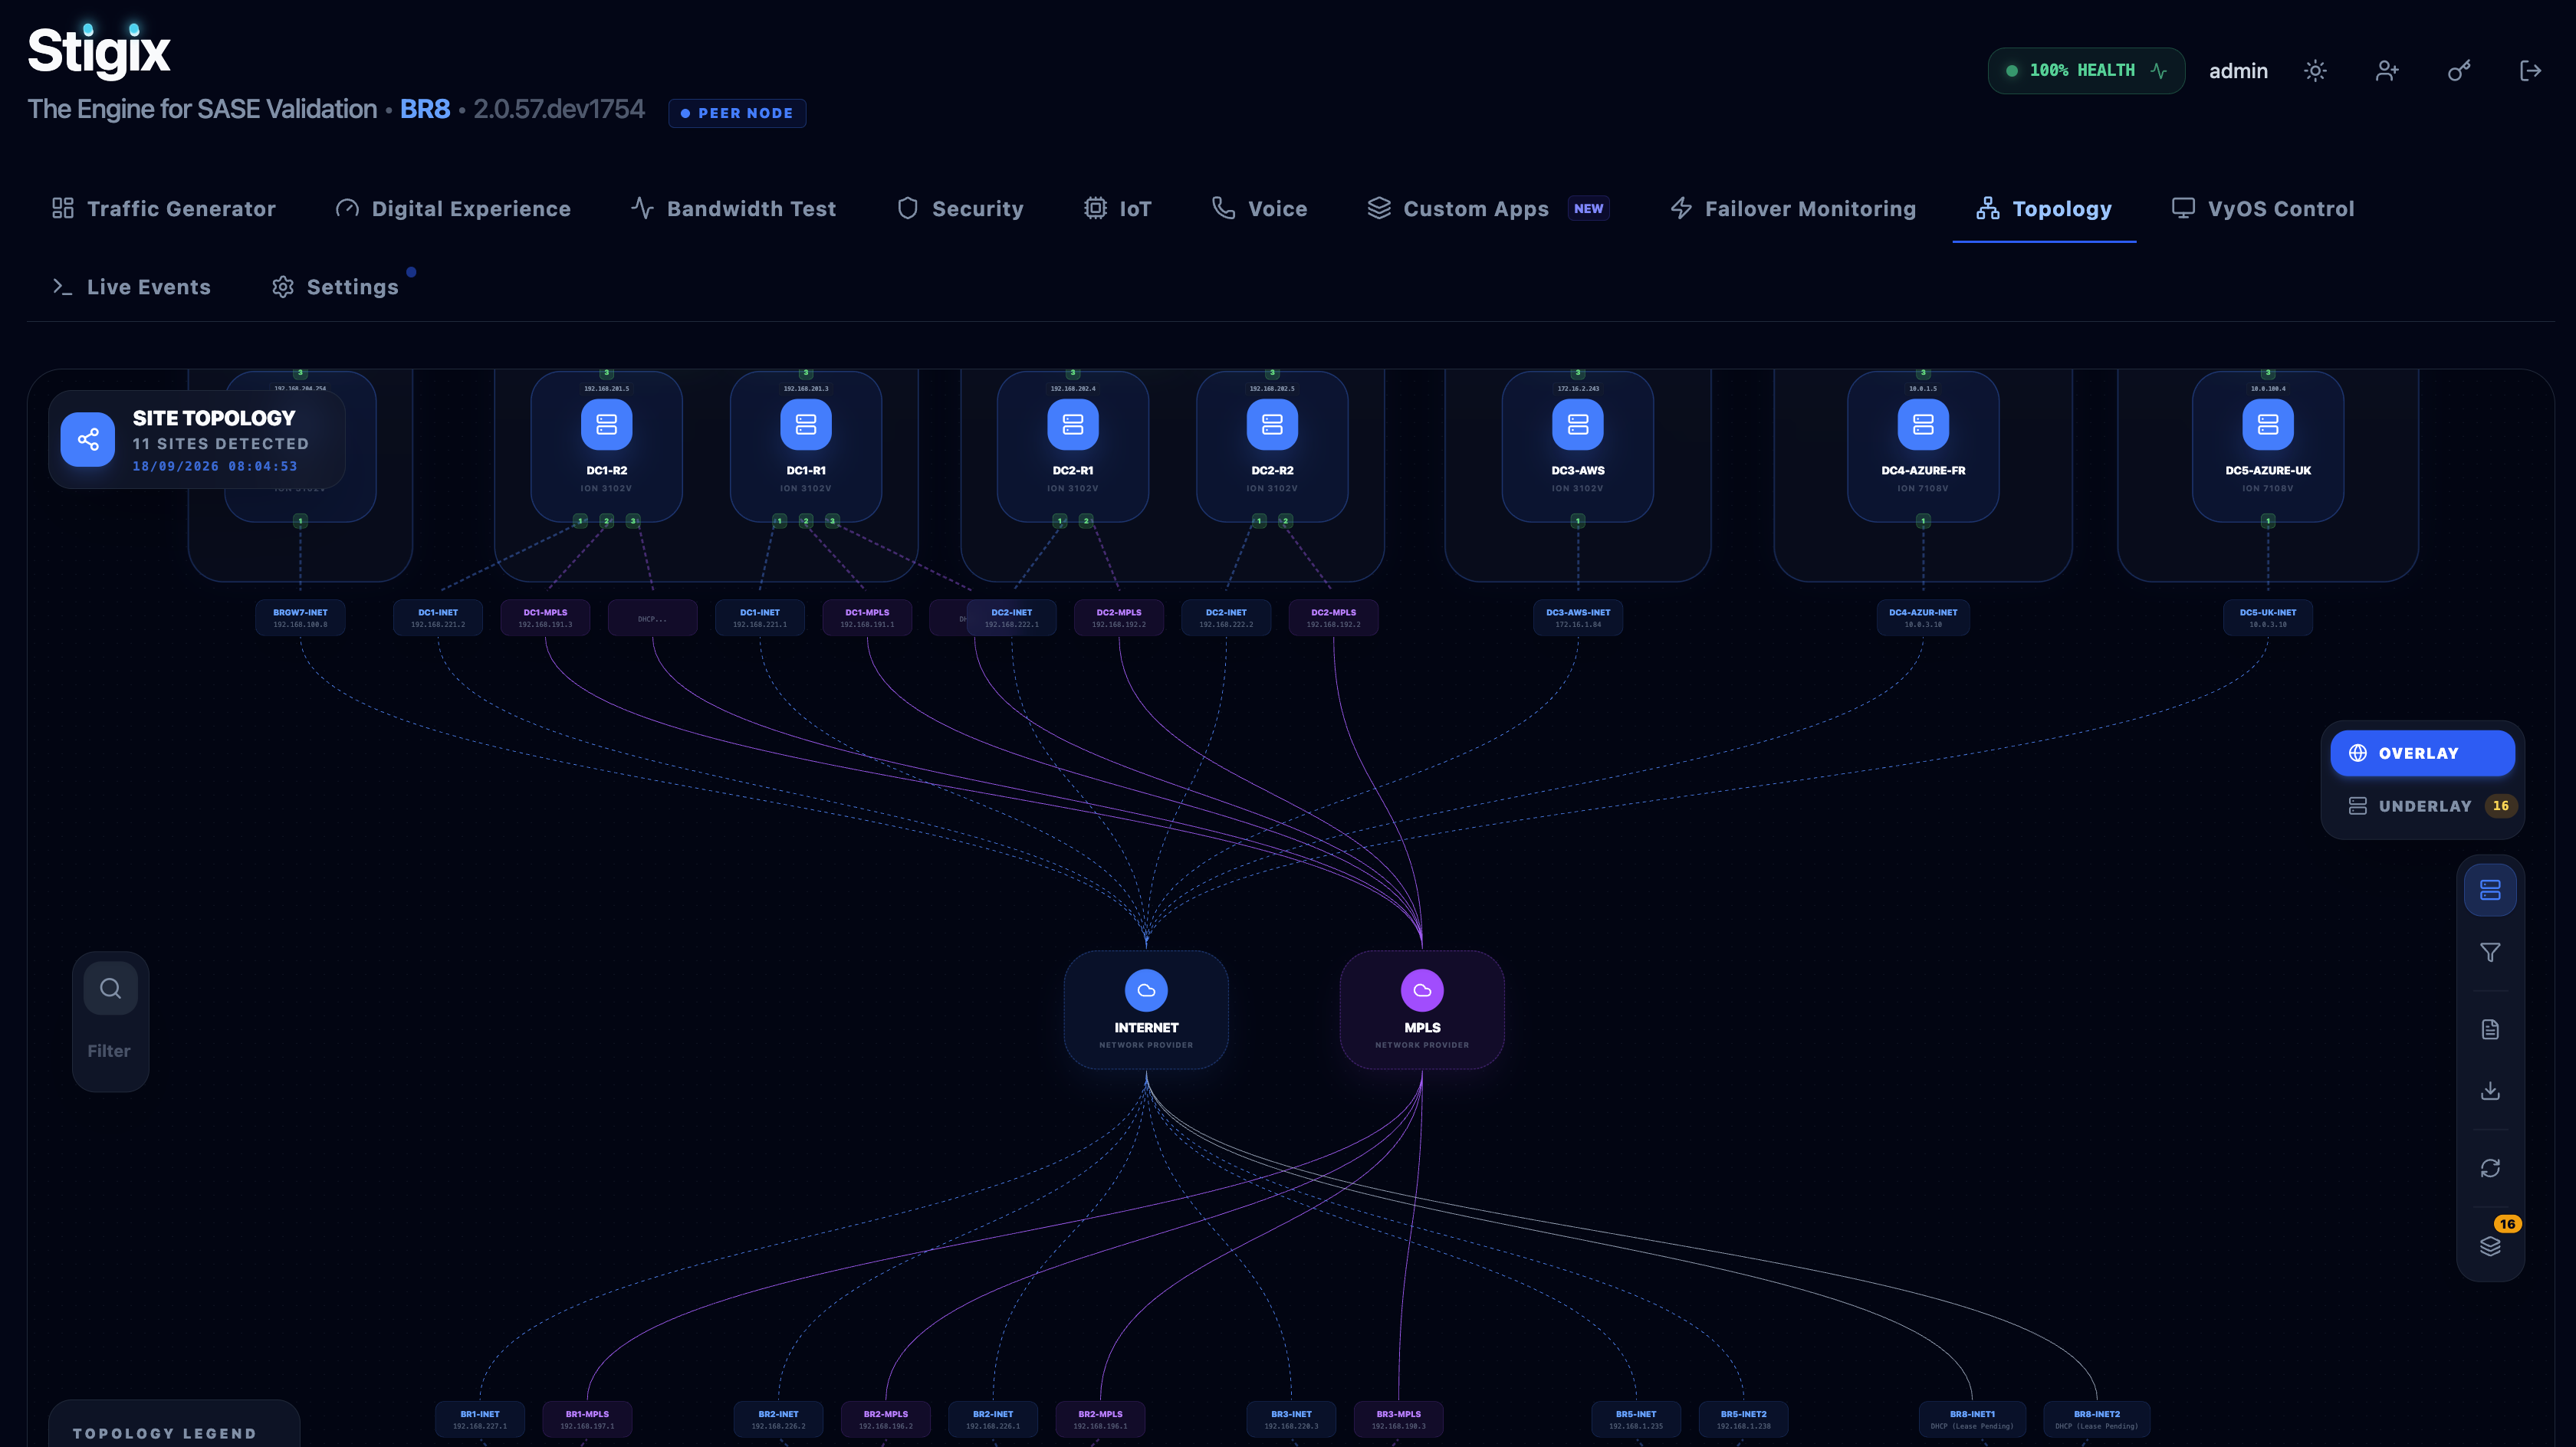
- Chassis Architecture: Separates Datacenter / Hub uplinks (top row of port chips) and Branch / Spoke downlinks (bottom row) with a central management status banner.
- Direct 1:1 Port Cable Wiring: Individual cables connect directly from each Prisma SD-WAN WAN circuit block to the exact physical
ethXport handle on the VyOS router. - Anti-Cable-Crossing Spatial Routing: Interfaces are sorted horizontally based on the geographic X-coordinates of connected branch sites (DC1, DC2, BR1, BR2, BR3) to ensure straight, parallel underlay cables.
- Full CIDR Visibility: Every physical port chip displays its full IPv4 CIDR subnet, port status LED, and link description.
In the Underlay Topology view, clicking any VyOS port chip opens the Direct Action Controls:
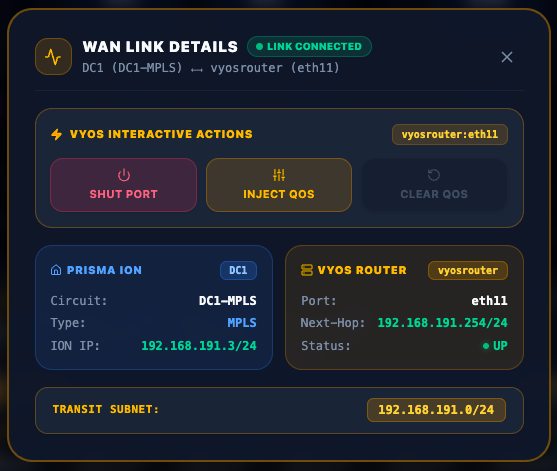
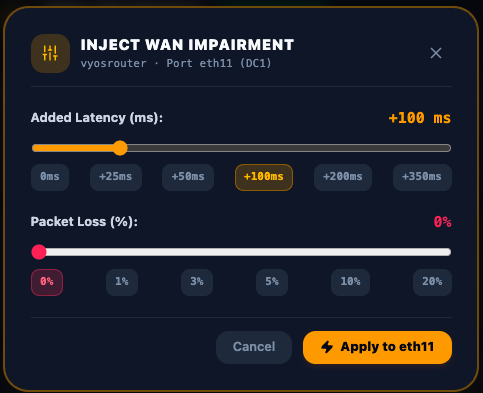
- Shut / No-Shut: Instantly toggles the interface administrative state on the router with live status write-through.
- Inject WAN Impairment (Netem): Adjust latency (0–500 ms) and packet loss (0–50%) sliders to inject impairments on the fly without writing scripts.
- Persistent Canvas Micro-Badges: Active impairments display dynamic amber badges (e.g.
⏱️ +100ms) directly on the router port chips on the canvas that persist across page reloads. - Clear QoS: 1-click button to immediately remove all traffic control rules and restore line-rate baseline performance.
Clicking any port chip or underlay cable triggers a floating Link Trace Drawer:
- Compares the Prisma ION WAN circuit parameters against the physical VyOS transit subnet and next-hop gateway IP.
- Displays link speed, circuit category (Public Internet, Private MPLS, LTE), and live BGP/routing health.
- Provides quick-action buttons to open the full diagnostics drawer or jump directly to the VyOS Control panel.
Currently supported (SD-WAN):
- VPN Overlay view — logical tunnel health per site pair
- Physical view — WAN interface status and termination points
- Real-time refresh during failover events
- HUB/DC filtering to simplify large fabric views
Not yet supported / in development:
- 🚫 Prisma Access / ZTNA overlay — GlobalProtect gateway status, mobile user connections, and service connections are not yet visualized. This is on the roadmap but has no confirmed release date.
- 🚫 Traffic flow overlay — showing active application flows on top of the topology map (planned)
- 🚫 Historical playback — replaying a topology snapshot from a specific point in time (e.g. during a recorded failover)
If you have a feature request or encounter a bug, open a GitHub Issue or contact contact@stigix.io.
The all-in-one image (jsuzanne/stigix:latest) is the recommended default. It bundles the web UI, backend API, traffic generator, and all engines into a single container.
docker run -d \
  --name stigix \
  --network host \
  -v stigix_config:/app/config \
  -v stigix_logs:/app/logs \
  --env-file .env \
  jsuzanne/stigix:latest
Legacy separate images (traffic-gen, web-dashboard, voice-server) remain available for advanced scenarios where you need to run components on different hosts. The docker-compose.yml at the project root covers both modes.
# 1. Is the container running?
docker ps | grep stigix

# 2. Check container logs for startup errors
docker logs stigix --tail=50

# 3. Is port 8080 bound?
ss -tlnp | grep 8080  # Linux
netstat -an | grep 8080  # macOS

# 4. Check for port conflict
# If another service is on 8080, change via PORT env var or -p flag
Common causes: Docker daemon not running, port 8080 already in use by another service, firewall blocking inbound connections, or a startup crash visible in docker logs.
Your configuration and logs are always preserved — they live in Docker named volumes that are never touched by an upgrade.
Method 1 — Simple (works on all Docker versions):
docker pull jsuzanne/stigix:stable
docker compose down
docker compose up -d
Pull the new image, stop the container, start fresh. Safe and universal — works with every Docker version including older ones.
Method 2 — Force-recreate (recommended after several upgrades):
docker compose down
docker pull jsuzanne/stigix:stable
docker compose up -d --force-recreate
The --force-recreate flag creates a brand new container even if nothing in the compose file changed. Useful when the container appears stale or behaves unexpectedly after an update.
Method 3 — One-liner (modern Docker only — Compose v2, Engine 23+):
docker compose up -d --pull always --force-recreate
Note: --pull always is only available in recent Docker versions. If you see an unknown flag error, fall back to Method 1 — it is fully equivalent and works everywhere.
docker-compose vs docker compose: Older systems may only have the legacy docker-compose binary (with a hyphen). Replace docker compose with docker-compose in any command if needed:
# Check which you have
docker compose version    # Compose v2 (built into Docker Engine)
docker-compose version    # Compose v1 (legacy separate binary)
After upgrading, confirm the new version in Settings → System Info or via the CLI: docker exec -it stigix stigix-cli --exec "status"
Every time you pull a new image, Docker keeps old image layers on disk unless you explicitly remove them. After several upgrades this commonly reaches 2–5 GB of wasted space.
First, check how much Docker is using:
docker system df
This shows image size, container size, volume size, and build cache. The Images and Build Cache rows grow with every upgrade.
Remove unused images only (safe, run regularly):
docker image prune -a
This removes all images not currently used by a running container. Your active Stigix image is kept, old versions are removed.
Full cleanup — removes everything unused (images, stopped containers, networks, build cache):
docker system prune -a -f
Important: docker system prune -a -f does not remove named volumes by default. Your Stigix configuration (stigix_config) and logs (stigix_logs) are stored in named volumes and are completely safe. Only unused images and stopped containers are deleted.
After pruning, simply restart Stigix:
docker pull jsuzanne/stigix:stable
docker compose up -d
When to clean up:
- After every 3–5 upgrades, or when
docker system dfshows more than 2 GB in images - On Raspberry Pi, Intel NUC, or any host with limited storage: prune after every upgrade
- If the host disk is above 80% full: run
docker system prune -a -fimmediately before your next upgrade
- ✅ Strong JWT secret — set
JWT_SECRETto a 32+ character random string - ✅ Changed admin password — set
ADMIN_PASSWORDin .env - ✅ HTTPS via reverse proxy — put nginx or Caddy in front; Stigix itself only serves HTTP
- ✅ Firewall restrictions — restrict port 8080 to trusted IPs; expose only 443 publicly
- ✅ Resource limits — set
--memoryand--cpuslimits on the container to prevent resource exhaustion - ✅ Log retention — configure Docker log rotation or mount logs to a monitored volume with retention policy
- ✅ Volume backups — back up
stigix_configvolume before updates
logs/traffic.log          → Live traffic generator requests (one per line)
logs/stats.json           → Aggregated per-app request distribution
logs/test-results.jsonl   → Security test history (one JSON object per run)
logs/voice-stats.jsonl    → Voice session results (MOS, jitter, loss)
logs/convergence-history.jsonl  → Convergence test records + egress path
logs/vyos-history.jsonl   → VyOS impairment execution audit trail
config/applications-config.json  → Traffic generator profile
config/security-profile.json     → Security test profile (multivendor)
config/connectivity-config.json  → Probe definitions
config/vyos-sequences.json       → VyOS impairment sequences
All log files are in newline-delimited JSON format (JSONL), making them easy to parse with jq, import into Elastic/Splunk, or analyze with Python/pandas.
stigix-cli is an interactive console and automation tool that connects to the Stigix backend API. It lets you trigger tests, view real-time stats, run security audits, control IoT devices, manage VyOS sequences, and monitor convergence — all from the terminal without touching the UI.
It is pre-installed inside the container. Launch it with:
# Interactive console (with autocomplete, history, status toolbar)
docker exec -it stigix stigix-cli

# Run a single command headless and exit
docker exec -it stigix stigix-cli --exec "status"

# Connect to a remote Stigix instance
docker exec -it stigix stigix-cli --url http://192.168.1.100:8080

# Execute a script file (one command per line)
docker exec -it stigix stigix-cli --script my-test-plan.txt
The interactive console supports F1 (help), F5 (refresh toolbar), Ctrl+L (clear screen), and tab autocomplete. Session tokens are saved in ~/.stigix-cli.json for seamless reconnection.
Traffic generator (traffic):
traffic start / stop / status
traffic speed [turbo|fast|normal|slow|0.5]  # set request rate
traffic density [1-20]                      # parallel workers
traffic stats                               # real-time counters
traffic export [file]                       # backup profile to JSON
traffic import <file>                       # restore profile from JSON
Security audits (security):
security suite                              # full automated audit (URL + DNS + Threat)
security url <url>                         # single URL test
security url-batch                          # all enabled URL categories
security dns <domain>                      # single DNS test
security dns-batch                          # all enabled DNS domains
security eicar [endpoint]                   # EICAR threat prevention test
security results [n]                        # last N results
security schedule url on 30                 # schedule URL tests every 30 min
security select-all url on                  # enable all URL categories at once
Convergence & failover (convergence):
convergence start --target 192.168.203.100 --pps 1000 --label DC1
convergence stop
convergence watch          # real-time loss + latency display
convergence history [n]    # past test results with blackout times
Bandwidth speedtest (speedtest):
speedtest run 192.168.203.100                             # default TCP test
speedtest run 192.168.203.100 --duration 30 --protocol udp # custom test
speedtest run 192.168.203.100 --direction bidirectional    # bidir
speedtest history                                          # past results
Speedtest streams real-time Tx/Rx throughput, RTT, and loss directly in the console as the test runs.
VoIP simulation (voice):
voice start                # interactive: choose target from list
voice start --target all   # start to all voice-capable nodes
voice stop
voice stats                # MOS, jitter, packet loss, RTT
DEM Probes (probes):
probes list
probes add --name HQ-GW --host 10.0.0.1 --type ping
probes remove <id>
probes stats               # global scores + latency averages
probes export / import     # backup and restore probe configs
Stigix Targets (target):
target list                # all nodes with capabilities and status
target add                 # interactive (prompts name + host)
target add --name DC1 --host 192.168.203.100
target enable / disable <name>
target export / import     # portable JSON backup
IoT Simulation (iot):
iot list
iot start / stop [device-id]   # one device or all
iot stats                      # packets sent, bandwidth
iot vulns [n]                  # CVE findings per device
iot import <file> --max-devices 20 --enable-security  # Prisma CSV or JSON
iot export
VyOS Control (vyos):
vyos list                  # connected routers
vyos sequences             # available sequences
vyos run <sequence-id>    # trigger a sequence
vyos stop <sequence-id>
vyos history [n]
vyos export / import       # router + sequence config backup
Prisma SD-WAN Flow Browser (flows): Requires Prisma API credentials configured in your .env.
flows query --site BR8
flows query --site BR8 --protocol tcp --dst-port 8082 --dst-ip 192.168.203.100 --minutes 15
Returns matching flows with source/destination, protocol, bytes, packet counts, and the SD-WAN path used (e.g. BR8-INET1 to DC1-INET).
System administration (system):
system info        # CPU, RAM, disk, uptime
system interfaces  # host network interfaces
system logs        # last 30 lines of backend logs
system restart     # restart the container services
system upgrade     # pull latest image and upgrade
Automation with script files: The CLI can run a plain text file with one command per line, making it easy to build repeatable test plans:
# test-plan.txt
auth login
traffic start
security suite
convergence start --target 192.168.203.100 --pps 500 --label PoC
voice start --target all
docker exec -it stigix stigix-cli --script test-plan.txt
The Stigix MCP Server provides a natural language interface to your entire SD-WAN validation mesh. Using Claude Desktop, you can manage traffic, run security audits, trigger speedtests, inject network impairments on VyOS, and monitor any node — all by typing plain English (or French).
The MCP server runs automatically on every Stigix instance on port 3100 — no extra setup needed. To connect Claude Desktop, add this to your claude_desktop_config.json (replace with your node IP):
{
  "mcpServers": {
    "stigix": {
      "command": "npx",
      "args": ["-y", "@modelcontextprotocol/inspector",
               "http://<STIGIX_NODE_IP>:3100/sse"]
    }
  }
}
Config file locations: macOS → ~/Library/Application Support/Claude/claude_desktop_config.json Windows → %APPDATA%\Claude\claude_desktop_config.json
After saving, fully restart Claude Desktop (Cmd+Q, reopen). Click the hammer icon — you should see Stigix with a green status and 79 tools available.
No Node.js? Use the Python bridge instead: clone the repo, run ./mcp-server/setup-bridge.sh, then point the config to the local Python bridge script. See MCP_SERVER.md for the full setup.
🔔 Claude Pro recommended: Stigix MCP sessions are tool-heavy — a single fabric-wide report or full security audit can invoke 10–20 tools and return thousands of tokens of data. The Claude free tier hits its usage limit very quickly under this load and will stop mid-session asking you to wait until the next usage window. A Claude Pro (or Teams / Enterprise) subscription is strongly recommended for a smooth, uninterrupted experience.
Yes, absolutely. This is one of the most powerful workflows enabled by the 79 FastMCP tools. Instead of manual data exports and spreadsheet charting, Claude can autonomously investigate live fabric metrics, correlate multi-site SD-WAN failover curves, analyze application-layer vs network-layer impairments, and synthesize comprehensive executive reports.
Available output formats & topics:
- Technical Whitepapers & PoC Validation Reports (PDF / Markdown / DOCX) with executive summaries, topology diagrams, failover latency curves, and SLA compliance tables.
- Resilience & Failover Audits (e.g. comparing BR8 to DC1 under simulated packet loss or link down conditions).
- DEM Path & Microsoft 365 Synthetic Analysis evaluating multi-hop DNS, TLS handshakes, and TTFB degradation.
Check out real examples generated via Stigix MCP in our public Reports & Whitepapers Gallery.
Just type naturally — Claude resolves your intent to the right API call automatically. Here are real prompts you can copy-paste into Claude Desktop:
Discovery & Status:
"Show me all available Stigix endpoints."
"Give me the full status of BR8."
"Generate a full report across all Stigix nodes."
"Compare BR8 and Hetzner side by side."
Traffic & Tests:
"Start application traffic generation on BR8."
"Set 10 parallel clients on Paris."
"Run a 30-second TCP speedtest between BR8 and DC1."
"Start a convergence test between BR8 and DC1 at 500 pps."
"Start voice simulation on BR8."
"What is the success rate of Teams on BR8?"
Security:
"What is the current security score for BR8?"
"Run a full security audit on BR8."
"Test URL filtering for the Hacking category on BR8."
"Run a DNS security test for the malware domain on BR8."
"Run an EICAR threat prevention test against DC1 from BR8."
DEM Probes:
"Give me the DEM summary for BR8."
"Trigger an immediate run of all DEM probes on BR8."
"Add a PING probe to 8.8.8.8 named Google-Test on BR8."
"Show me historical DEM stats for BR8 over the last hour."
Config Cloning:
"Clone the full configuration from BR8 to BR5: apps, probes, security profile, and VyOS scenarios."
"Copy only the DEM probes from BR8 to BR5."
"Export BR8's app config, then import it to Paris."
This is one of the most powerful MCP features. Claude can inject latency, loss, rate-limits, and IP blocks on VyOS routers using natural language — with a mandatory confirmation step before any destructive action.
Example prompts:
"Add 150ms of latency on the MPLS link of BR8."
"Add 5% packet loss on the WAN interface of the router on BR8."
"Block traffic to 192.168.1.50 on the router managed by BR8."
"Shut the MPLS interface on BR8's router."
"Clear all active QoS on the router managed by BR8."
"Do a full reset of BR8's router — QoS, IP blocks, and downed interfaces."
"What is the current state of the router managed by BR8?"
How it works: Claude first calls get_vyos_interfaces to discover the router interfaces and their descriptions (e.g. BR1-MPLS-197). It then resolves your intent to the right interface, presents the proposed action with the exact interface name, and waits for your yes/no confirmation before executing. Destructive actions (shut, block, deny) are never applied without explicit user confirmation.
Prerequisite: VyOS interface descriptions must be set for natural language resolution to work. Example: set interfaces ethernet eth1 description "MPLS-Link-DC1"
You can also check the live router state anytime:
"What is the current state of vyosrouter managed by BR8?"
Returns: per-interface admin status (up/down), active QoS parameters (delay, loss, rate), and all active IP blocks — in a single call.
You only need to connect Claude Desktop to one node. Thanks to the distributed architecture, that node automatically has visibility over the entire mesh via the autodiscovery registry — and can orchestrate any other node from there.
However, for cross-node operations (e.g. launching a speedtest from BR5 via the MCP connected to BR8), all nodes must share the same JWT_SECRET. The install script generates a unique random secret per node, so in a multi-node setup you need to manually synchronize it:
# Check current secret on each node
docker exec stigix printenv JWT_SECRET

# Set the same shared secret on every node
echo "JWT_SECRET=<your-shared-secret>" >> ~/stigix/.env
docker compose restart
If cross-node tests return empty results (tests: []), a mismatched JWT_SECRET is almost always the cause. Verifying this is the first debug step.
After upgrading Stigix (container restart), Claude Desktop loses the SSE connection. Simply quit and reopen Claude Desktop — the connection re-establishes automatically. You do not need to change claude_desktop_config.json.
No. Stigix never sees your natural language prompts. The translation happens entirely on Anthropic's servers:
You type:  "What is the security score for BR8?"
               ↓ sent to Anthropic (Claude LLM)
          Claude reasons → selects tool + arguments
               ↓ structured JSON-RPC call
          {"name": "get_security_results_stats", "arguments": {"agent_id": "BR8"}}
               ↓ SSE → port 3100
          Stigix MCP Server receives only the structured call
Stigix logs only the tool call metadata to mcp-history.jsonl: tool name, target node, duration in ms, and status. Your conversational text is never logged by Stigix.
This means:
- Privacy: your prompts stay between you and Anthropic's API
- Debugging: if a tool is called with wrong arguments, the issue is in Claude's reasoning (tool docstring quality), not in Stigix itself
- Audit trail:
Settings → MCP Servershows a real-time color-coded feed of every tool call with category icon, duration bar, node badge, and timestamp
In a multi-node Stigix deployment, every node needs to know the IP address of every other node to run speedtests, convergence tests, and voice sessions. Without a registry, you would have to manually enter the IP of every peer in every node's Settings — and repeat the process every time an IP changes.
The Stigix Registry solves this completely. It is a lightweight Cloudflare Worker running at registry.stigix.io that acts as a shared discovery board. Each Stigix instance:
- Registers itself (IP, capabilities, site name) every 60 seconds via a heartbeat
- Pulls the full peer list every 30 seconds via discovery polling
- Automatically removes nodes that stop heartbeating after 5 minutes (TTL)
Result: when a new Stigix node starts up, it finds all its peers within 30–90 seconds — with zero manual configuration. Peers appear in the dashboard with an Auto badge and a Registry Provided tooltip, distinguishing them from manually added targets.
The registry is also used by the MCP Server to maintain mesh-wide visibility — so Claude Desktop can see and control all nodes from any single entry point.
The Stigix Key (called Stigix Master Key in the UI) is a token that groups your nodes together in the shared Cloudflare registry and signs cloud probe requests so only your infrastructure can use them.
Step 1 — Request your key: Send an email to contact@stigix.io with subject "Stigix Registry Key Request". Include your organization name and number of nodes. You'll receive a key value by return.
Step 2 — Enter it directly in the dashboard (no restart required):
- Go to Settings → Target Controller
- Scroll down to Cloud Target Security ("Probe Signing & Master Credentials")
- Paste your key in the Stigix Master Key field
- Click Update Security
The badge next to the field instantly shows + MASTER KEY ACTIVE. Repeat on every node in your deployment — all nodes must share the same key to recognize each other.
Already using Prisma SD-WAN? If PRISMA_SDWAN_TSGID + credentials are configured, the key is derived automatically from your TSG ID. No manual entry needed — nodes in the same Prisma tenant are automatically grouped.
Getting a node to register itself and discover its peers is a 2-step process — no command line needed after the initial install.
Step 1 — Enter your Stigix Key in the dashboard:
Go to Settings → Target Controller → Cloud Target Security. Paste the key you received from contact@stigix.io into the Stigix Master Key field and click Update Security. The badge shows + MASTER KEY ACTIVE immediately — no restart needed.
No key yet? If you have Prisma SD-WAN credentials already configured, skip this step — the key is derived automatically from your TSG ID.
Step 2 — Verify registry status:
Go to Settings → Target Controller. The Configuration State panel should show:
- Bootstrap URL:
https://registry.stigix.io - PoC Registry Key: shown as dots (key active)
- Cloudflare Online badge in the top-right of the Target Controller Dashboard
Within 30–90 seconds, other nodes registered with the same key will appear in your Targets list with an Auto badge — no manual IP entry needed.
For large multi-site deployments, Stigix adds a Leader/Peer layer on top of the global registry. One node (typically the DC or a central hub) acts as a Leader — it hosts a local registry service and pushes a centralized target list to all other nodes (Peers). This gives you sub-minute synchronization without depending on Cloudflare for every heartbeat.
Step 1 — Designate the Leader node:
On your central/DC node, go to Settings → Target Controller. Under Registry Role Override, click Force Leader. No restart needed — the role switch is instant and the node immediately announces itself to the Cloudflare registry.
Step 2 — Add your shared targets on the Leader:
In Settings → Targets on the Leader node, add any custom targets you want all Peers to see (internal servers, specific probe endpoints, other Stigix nodes). These are the targets that will be propagated.
Step 3 — Leave Peers on Auto-Detect:
All other nodes should stay on the default Auto-Detect mode (or set STIGIX_REGISTRY_MODE=auto in .env). They will automatically discover the Leader via Cloudflare within 60–90 seconds and switch to the local Leader for high-frequency updates.
What happens automatically:
- Every 30 seconds, Peers pull the full target list from the Leader — targets appear with an Auto + Leader Provided badge
- New nodes joining the PoC discover the Leader and receive all targets immediately
- If the Leader goes offline, Peers fall back to the Cloudflare registry automatically within 60 seconds (self-healing)
- If a Peer uses a Leader-provided target in a test, it gets a Static badge too — meaning it's now saved locally and survives a Leader outage
Step 1 — Check registration status:
curl -s http://localhost:8080/api/registry/status | python3 -m json.tool
Look for:
"is_registered": true— the node is registered with the global registry"poc_id"— should match your TSG ID (or your PoC identifier)"peer_count"— number of peers currently discovered
Step 2 — Test connectivity to the registry:
curl -I https://registry.stigix.io/instances
A 403 Forbidden is normal (authentication required). A 521 or timeout means the host cannot reach Cloudflare — check your outbound firewall rules for HTTPS on port 443.
Common causes and fixes:
- Registry not enabled — verify
STIGIX_REGISTRY_ENABLED=truein.envand restart - Wrong key / hash mismatch — if one node registered first with a different key, the registry rejects all subsequent nodes. Contact contact@stigix.io to flush the PoC entry, or wait 48h for automatic expiration
- Peers not appearing — wait 30–90 seconds after registration. If still not showing, verify all nodes share the same
STIGIX_TARGET_MASTER_KEY(or the same Prisma TSG ID) - Leader unreachable by Peers — if Peers show "Falling back to Cloudflare", check that port
8080on the Leader is reachable from the Peer hosts (firewall / security group) - No leader elected — in a pure-Peer setup with no designated Leader, nodes will work but only with Cloudflare-frequency updates (5-min heartbeat). For sub-minute sync, always designate one Leader
Remote View allows an operator connected to a Leader node (e.g. DC1) to observe, monitor, and control any remote peer node (e.g. BR1, BR2, BR5, BR8) directly within the Leader's dashboard — without opening separate browser tabs or authenticating to each node individually.
How it works under the hood:
- The Leader acts as an API Gateway proxy (
/api/gateway/:peerId/*). - All dashboard API calls (reads and writes) are transparently rewritten by the client-side interceptor (
gFetch) and routed through the Leader to the target peer over the existing SD-WAN underlay/overlay. - The operator's browser stays permanently on the Leader URL — no direct IP routing from your laptop to the branch subnets is required.
- Live SSE streams (Speedtest throughput graphs, log streams) are piped in real-time through the gateway.
- Clear visual indicators confirm active remote mode: amber site name in the header, amber navbar chip, and an amber perimeter frame with zero layout shift.
In real-world enterprise deployments, branch sites and edge nodes are often positioned behind strict egress-only firewalls, NAT, or Carrier-Grade NAT (CGNAT) without public IP addresses or inbound port forwarding.
Stigix solves this via persistent WebSocket Reverse Tunnels:
- Outbound-Only Initiation: Spoke nodes automatically discover the Leader and establish an outbound WebSocket connection to the Leader's
/fleet-tunnelnamespace. - Zero Inbound Ports on Spokes: No ports need to be opened on branch routers or perimeter firewalls.
- Full-Duplex Multiplexing: When the operator interacts with the remote peer in the dashboard, API requests and responses are seamlessly multiplexed through the existing persistent WebSocket tunnel.
- Ultra-Low Bandwidth Overhead: When idle, the tunnel generates less than 0.5 kbps per node (~50 bytes/s) for keepalive and telemetry heartbeats.
- Seamless Fallback: Direct peer-to-peer HTTP is automatically used if a direct LAN path is available.
In hybrid architectures, the Leader node often resides in a protected private LAN/Datacenter that cannot be exposed directly to the public Internet, while some Stigix peers run on public Cloud VMs (e.g. Hetzner, AWS, Azure) or remote Home LANs.
With Leader Outbound Reverse Dialing:
- Inverted Dialing: The private Leader dials outbound to the configured Cloud Peer's
/fleet-tunnelendpoint (e.g.http://<CLOUD_IP>:8080/fleet-tunnel). - Zero Public Inbound on Leader: The Leader remains completely private with zero inbound ports open to the Internet.
- Automatic Bi-directional Telemetry: Once the connection is established, the Cloud Peer automatically pushes its live telemetry (DEM scores, probes, traffic metrics) into the Leader's local registry.
- Complete Remote Control: Operators on the private Leader can switch context to any external Cloud Peer with full read/write management through the dialed reverse tunnel.
Stigix provides end-to-end Bidirectional Global Provisioning that functions transparently over persistent WebSocket reverse tunnels (both inbound NAT spokes and outbound dialed Cloud peers):
- Instant Change Broadcast: Whenever an operator edits or publishes configuration bundles (Custom TCP Apps, synthetic probes, VoIP simulation, security policies, IoT devices) on the Leader, the Leader broadcasts a
peer:bundle_updatedpush notification over active WebSocket tunnels. - Tunnel Pull Sync: Remote peers immediately request the latest bundle revisions directly through the existing multiplexed tunnel — requiring zero direct IP routing back to the private Leader.
- Zero-Downtime Hot Reload: Spoke daemons and workload generators update their in-memory configurations dynamically without container restarts.
- Visual State Tracking: In Settings → Target Controller, remote nodes display a
⚡ WS Tunnel Syncedstatus badge confirming automated synchronization from the controlling Leader.
Traditional network testing tools (like iPerf or raw HTTP GET loops) do not accurately reflect real enterprise application dynamics. Real enterprise applications (SAP ERP, Oracle, POS cash registers, core banking, database sync, industrial SCADA) rely on persistent, long-lived TCP connections with paced request/reply transactions and server-side compute delays.
Because every Stigix instance operates simultaneously as a TCP Server Listener and a TCP Client Workload Generator, Custom TCP Applications support all SD-WAN traffic flows without restriction:
- North-South (Vertical / Hub-and-Spoke): Branch ⟷ Datacenter / HQ hub, simulating remote offices accessing centralized application servers and databases.
- East-West (Horizontal / Site-to-Site): Branch ⟷ Branch or Plant ⟷ Plant direct mesh communication across the SD-WAN overlay without transiting the datacenter.
- Full Any-to-Any Mesh: Multi-site topologies where all nodes concurrently generate and receive transactional TCP workloads.
In enterprise SD-WAN and APM monitoring, relying solely on the arithmetic Average (Avg) is dangerously misleading:
Example: If 99 requests take 10 ms and 1 request suffers a 1,000 ms freeze (due to a WAN brownout or TCP retransmission), the average calculates to (99 × 10 + 1000) / 100 = 19.9 ms. The dashboard shows ~20 ms (looking normal), completely hiding the 1-second freeze experienced by the user!
To reveal the true user experience, Stigix calculates Rolling Percentiles across active TCP sessions:
Avg(Mean): Arithmetic average across all samples.p50(Median): 50% of requests are faster than this value. Represents the typical daily user experience, unaffected by isolated spikes.p95(95th Percentile): 95% of requests are faster than this value (the top 5% worst cases). This is the gold standard for SD-WAN SLA testing to detect jitter, packet loss, queueing, and failover recovery.Max: The absolute peak RTT recorded in the sampling window.
Diagnosis rule of thumb: If p50 ≈ p95 (e.g. 12ms and 15ms), the WAN path is rock solid. If p50 = 15ms but p95 = 450ms, your SD-WAN path is experiencing micro-outages or bufferbloat.
When running custom TCP traffic over Prisma SD-WAN, ION appliances classify unrecognized ports as generic unknown or tcp. With Stigix's built-in Prisma SD-WAN Integration (accessible via the Cloud icon in Settings → Custom TCP Apps):
- 1-Click AppDef Sync: Stigix registers application definitions (e.g.
STX_Onprem8084on port8084) directly on your Palo Alto Networks Prisma SD-WAN tenant. - Flow Browser Visibility: Synthetic flows between branches and datacenters are immediately recognized and labeled under their true business name in the Flow Browser.
- Analytics & Policy Enforcement: Measured in bandwidth analytics charts and eligible for application-based QoS / Path Steering policies.
- Delta Sync & Clean All: Automatically syncs deltas without duplicate API calls and provides 1-click lab teardown.
Every Stigix application profile contains two functional components:
- Server Role (Listener & Server Behavior): Binds a TCP port on the host (e.g.
:8443) and responds to incoming requests according to its response mode (Echo, Fixed Delay, Looping Delay, Drop, Error). - Client Role (Workload Generator & Peers): Emits structured requests toward remote target peers at configured pacing intervals and payload sizes.
Who executes what?
- On a Client-only Branch node: The client executes its workload settings and targets remote peers. Its local
Server Behaviorremains dormant. - On the Target Server node (e.g. DC): The
Server Behaviorconfigured on that remote server executes to reply to branch requests (e.g. injecting database processing time or error frames).
Stigix provides 9 realistic server response modes:
echo— Immediate full payload reflection without delay.acknowledge— Ultra-compact ACK reply (12 bytes, zero payload) for high-frequency transactions.fixed_delay— Constant server-side latency injection (e.g. 150 ms simulating remote database query).random_delay— Jittered delay between configurable Min and Max bounds (e.g. 50–300 ms).looping_delay— Cycles periodically between normal latency (e.g. 10 ms for 60s) and slow latency (e.g. 1500 ms for 60s) — perfect for validating SD-WAN SLA-based failover without pulling cables.drop_response— Silently drops responses with configurable probability while keeping the TCP socket open (simulating application freeze/timeout).close_connection— Abruptly closes the TCP connection after N requests (simulating server crash).error_response— Replies with an application error frame carrying custom error codes (e.g.SIMULATED_DB_ERROR).eicar_response— Emulates a malware payload returning the standard EICAR anti-virus signature, validating Next-Gen Firewall / SASE (Palo Alto Networks Antivirus / WildFire) inline inspection and blocking.
In Stigix, you can choose between two Wire Protocols for each custom application:
- ⚡ Stigix Native TCP (L4 Binary): Uses length-prefixed binary framing (4-byte length prefix). It has zero HTTP overhead, making it ideal for pure underlay throughput benchmarks and transport-level failover validation.
- 🌐 HTTP/1.1 REST API (L7 Native): Formats transactions as RFC-compliant HTTP/1.1 request-response cycles while injecting
X-Stigix-*telemetry headers.
Why is HTTP/1.1 needed for SD-WAN Server Response Time (SRT)?
At Layer 4 (raw TCP), an SD-WAN appliance (e.g., Prisma SD-WAN / ION) only sees kernel TCP ACKs (which return in < 2 ms) and cannot delineate where a transaction starts or ends. By selecting HTTP/1.1 REST API, the SD-WAN App-ID engine identifies the HTTP request and response boundaries, allowing it to compute and display true Server Response Time (SRT) (e.g., ~800 ms) in the Flow Browser alongside transport RTT (~8 ms).
In Settings → State Persistence, the auto_restart_custom_tcp toggle (enabled by default) ensures that your Custom TCP applications restore their exact runtime state upon restart:
- Listeners: Host ports that were listening before shutdown resume listening automatically.
- Client Workloads: Workload streams that were actively transmitting traffic before reboot resume their test cycles immediately.
Whenever you click Start / Stop Listener or Start / Stop Client Workload in the UI, the state is persisted automatically to disk.
Stigix tracks round-trip time across a rolling sample buffer, calculating min, avg, max, $p50$ (median), and $p95$ (95th percentile) latency.
The 0–100 Health Score synthesizes operational quality across 4 weighted factors:
Health Score = Listener Active (25 pts) + Sessions Established (35 pts) + Success Rate (25 pts) + Latency SLA (15 pts)
- 90–100 [OPTIMAL]: Port open, all streams connected, RTT < 50ms.
- 75–89 [HEALTHY]: Nominal operation, low latency.
- 50–74 [DEGRADED]: Elevated latency or partial reconnects.
- 0–49 [CRITICAL]: Remote peer unreachable or port blocked by firewall.
In the Custom Application Creation/Edition Wizard (Step 3), enabling Zero-Touch Auto-Start Traffic (startup.startClientWorkload: true) instructs peer nodes across your SD-WAN fabric to automatically begin generating synthetic client sessions upon syncing the configuration bundle from the Leader.
This delivers true zero-touch orchestration: central network architects can define an application on the Datacenter Leader, target 50 remote branch offices, publish the revision, and immediately observe live East-West traffic flows and latency statistics without manually interacting with any individual branch dashboard.
Unlike software server simulations, real network impairments (injected via VyOS netem, WAN emulators, or physical fiber cuts) are detected across multiple protocol layers:
- Network Latency & Jitter: Every transaction is tracked from emission to reception. A 200-sample sliding window calculates real-time p50 (median) and p95 (tail latency) percentiles, penalizing the SLA Health score if latency spikes.
- Packet Loss & Retransmissions: TCP retransmissions inflate RTT. If packet loss delays a response past
requestTimeoutMs(5s), a Timeout is logged, degrading the transaction success ratio. - Link Cuts & SD-WAN Failover: A broken path immediately transitions sessions to
RECONNECTINGwith bounded exponential backoff and jitter. As soon as the SD-WAN re-routes traffic to the backup path, sessions automatically reconnect and resume traffic with zero manual intervention.
For complete architecture details and lab testing recipes, see the Network Impairment & SD-WAN Failover Validation Guide.
In addition to latency and throughput benchmarking, Stigix Custom TCP Apps support in-band Threat Prevention validation across custom business protocols (HL7, DICOM, FIX, Modbus, custom HTTP/TCP):
- When the
eicar_responseimpairment mode or security profile is enabled, the server injects the standardized EICAR anti-virus test signature inside the application payload stream. - The client runtime inspects received bytes in real time. If the Next-Generation Firewall or SASE security policy (e.g. Palo Alto Networks Antivirus / WildFire) is functioning correctly, the session is reset or blocked inline.
- If the payload reaches the client, the client explicitly tags the session as EICAR Detected (Security Bypass), providing irrefutable proof for security audits.
Central Global Provisioning allows a central Stigix Leader node to distribute configuration bundles across all registered branch peers in an automated pull-mode cycle (30s interval).
When an administrator creates or edits applications, probes, or policies on the Leader, the Leader generates an atomic revision (e.g. rev-3.json). Connected branch peers detect the new revision, pull the updated bundle, and hot-apply the changes without restarting containers or interrupting other services.
Global Provisioning manages 8 independent configuration bundles:
- SaaS Applications: 67 pre-configured SaaS application profiles and traffic weights.
- Synthetic Connectivity Probes: HTTP, ICMP, and TCP endpoint monitoring probes.
- SLA & Digital Experience Targets: Performance threshold targets and health rules.
- Security Validation Policies: URL filtering, DNS security, and threat testing suites.
- Voice Simulation Servers: RTP voice server targets and codec profiles.
- IoT Simulation Profiles: Virtual IoT device profiles and attack scenarios.
- Prisma SD-WAN API Credentials: SASE tenant API integration parameters.
- Custom TCP Applications: Multi-application East-West definitions, listeners, and peer lists.
Pull-mode synchronization operates on two synchronized cadences:
- Adaptive Heartbeat Sync (Every 60s): Connected branch peers query the Leader's
/provisioning/manifestendpoint at each heartbeat cycle. If a revision or checksum mismatch is detected, the peer pulls and hot-applies only the changed bundle. - Instant On-Demand Sync (0s): Clicking SYNC NOW in Settings → Central Global Provisioning (or running
stigix-cli provision sync) immediately triggers an out-of-band pull without waiting for the background timer. - Container Boot / Restart: When any branch node boots up, it pulls the latest published revisions from the Leader immediately during startup.
Every published revision includes an atomic SHA-256 cryptographic checksum generated over the normalized payload. When a branch peer pulls a bundle:
- It verifies the SHA-256 hash before applying the configuration to disk.
- Hot-reload engines update in-memory state and disk files atomically.
- If a checksum mismatch occurs, the peer safely rejects the corrupted payload and retains its active configuration, reporting an error state back to the Leader.
To join a remote Linux box, VM, or Raspberry Pi to a Stigix Leader, run the one-line onboarding command on the remote host:
curl -fsSL https://raw.githubusercontent.com/jsuzanne/stigix/main/install.sh | sudo bash -s -- --controller http://<LEADER_IP>:8080
The script automatically:
- Verifies Docker is installed and running on the host, then downloads the configuration and pulls the Stigix container image.
- Configures
STIGIX_CONTROLLER_URLand activates Direct Controller Mode. - Registers the peer with the Leader and immediately begins pulling published Global Provisioning bundles.
- The Leader automatically discovers the new peer and synthesizes active target definitions on its dashboard.
No. Stigix uses a pure outbound pull-mode architecture. Branch peers initiate standard outbound HTTP/HTTPS connections (TCP 8080 / 443) to the central Leader.
There is zero requirement to open inbound firewall ports, configure port forwarding, or assign public IP addresses to remote branch sites. It operates flawlessly across NAT, Carrier-Grade NAT (CGNAT), private MPLS circuits, SD-WAN IPsec overlays, and restricted enterprise lab firewalls.
Complete operational survivability. Branch instances cache all active configuration bundles locally on persistent disk volumes (/data/stigix/).
If WAN connectivity to the Leader is severed or the Leader undergoes maintenance:
- Branch nodes continue generating traffic, listening on custom TCP application ports, evaluating SLA targets, and executing scheduled security tests with zero downtime.
- When connectivity is restored, branch nodes resume heartbeat synchronization and automatically catch up with any newly published revisions.
When you define a Custom TCP Application (e.g. SAP-ERP on port 3200 or DICOM-PACS on port 104) on the Leader, the definition is packaged into the custom-tcp-apps bundle.
Once published, all target branch peers download the revision, dynamically spawn persistent multi-threaded TCP listeners, and register them as valid East-West traffic targets. This turns a complex multi-site application simulation into a 1-click central operation.
Stigix ships with a full CLI provisioning command suite for headless automation and CI/CD scripting:
# View Leader provisioning status, manifest revisions, and connected peers
stigix-cli provision status

# Force an immediate on-demand configuration pull on the local node
stigix-cli provision sync

# Publish a new bundle revision from the Leader
stigix-cli provision publish custom-tcp-apps

# Roll back a bundle to a specific revision across the entire mesh
stigix-cli provision rollback custom-tcp-apps 2

# List all connected branch nodes, last seen timestamps, and sync latency
stigix-cli provision peers
Every branch node transmits a telemetry heartbeat at regular intervals. The Leader aggregates these heartbeats in real-time under Settings → Mesh Provisioning, displaying a live Mesh Matrix showing:
- Connectivity Status: Live online / offline indicators with last-seen timestamps.
- Revision Alignment: Per-bundle revision tracking (e.g.
rev-4vsrev-3) highlighting synchronized nodes. - Sync Latency: Real-time propagation time from Leader publication to branch hot-reload.
- Alerting: Visual warnings if a peer reports a SHA-256 mismatch or fails to pull a new revision.
Stigix supports safe, staged validation workflows:
- Draft Mode: You can configure and test new security test profiles or custom application traffic locally on the Leader or a single testbed instance without publishing.
- Publish Revision: When validation succeeds, clicking PUBLISH REVISION (or running
stigix-cli provision publish) broadcasts the bundle to the entire mesh. - Instant Rollback (< 30s): If an issue arises in the field, clicking ROLLBACK immediately reverts all branch instances to the previous known-good revision in under 30 seconds.
Local Overrides & Orphan Protection:
Branch nodes can locally enable or disable specific items without breaking central synchronization. If a centrally provisioned item is modified locally, Stigix marks it with an override badge to preserve local operational choices.
Instant Rollback:
In Settings → Mesh Provisioning (or via CLI stigix-cli --exec "provision rollback custom-tcp-apps 2"), the Leader can roll back any bundle to a previous revision. All branch peers immediately pull and apply the restored revision within 30 seconds.
Stigix provides two distinct discovery & registration modes:
- Direct Controller Mode (
STIGIX_CONTROLLER_URL): Ideal for private enterprise labs, air-gapped data centers, or restricted environments without public internet. Remote branch nodes connect directly to the Leader's private IP/URL via HTTP/HTTPS. Cloudflare is completely bypassed with zero external dependencies. - Cloudflare Workers Autodiscovery: Ideal for distributed multi-cloud or public internet environments where nodes discover each other dynamically through a shared Cloudflare Worker without specifying static Leader IPs.
As soon as a remote branch node registers with the Leader, the Leader's Dynamic Target Synthesis Engine automatically inspects the peer's capabilities (Voice Echo, Convergence Lab, XFR speedtest, Custom TCP listeners) and creates active target definitions in the Stigix Targets Repository.
Engineers can immediately select the new branch site from target dropdowns in Failover Lab, Voice, or Performance without manually creating endpoints or typing IP addresses.
To easily navigate multi-site deployments, Stigix defines a clear set of architectural concepts:
- Leader (Controller Node): In Stigix terminology, the Leader is the central controller instance that hosts the local registry server, coordinates global configuration publishing, and serves the single-pane-of-glass Fleet Gateway. "Leader" is an application role — not a hardware or physical datacenter requirement. Any Stigix instance (on-premise server, cloud VM, or lab workstation) can be designated as the Leader with one click.
- Peer / Instance: Any individual running Stigix node (e.g. running on branch servers, cloud VMs like Hetzner/AWS, or physical lab hosts).
- Spoke (Branch Node): A remote Stigix peer that connects back to the Leader to pull configuration bundles, stream telemetry, and participate in mesh performance tests.
- Fleet Gateway & Remote View: The built-in reverse proxy (
/api/gateway/:peerId/*) on the Leader allowing operators to observe and manage any remote peer directly in the Leader dashboard without opening separate browser tabs. - WebSocket Reverse Tunnel: The persistent, multiplexed full-duplex session established between a Spoke (or Cloud VM) and the Leader, allowing API calls and telemetry to traverse firewalls, NAT, and CGNAT with zero inbound ports required on the branch.
- Target Site / Synthetic Target: Any endpoint (another Stigix node or third-party host) that receives synthetic probes, Voice Echo streams, or XFR bandwidth tests.
- Global Provisioning Bundles: Centralized configuration packages (Custom TCP apps, synthetic probes, VoIP settings, IoT profiles, security policies) maintained on the Leader and hot-reloaded fleet-wide.
Stigix is built for real-world enterprise architectures, where network security rules and NAT boundaries dictate connectivity. Stigix supports 4 primary deployment topologies:
- Topology 1 — Pure Corporate WAN / SD-WAN / MPLS (Direct Mesh): Full bidirectional IP reachability between all sites. Direct HTTP REST API calls and peer-to-peer data traffic with sub-second synchronization.
- Topology 2 — NAT / CGNAT Branch Spokes to Private Leader: Branch sites located behind egress-only NAT, 4G/5G routers, or corporate firewalls initiate persistent outbound WebSocket reverse tunnels to the private Leader. Zero ports open on the branch.
- Topology 3 — Zero-Inbound Private Leader + External Cloud Peers: Private Leader resides entirely inside a protected corporate LAN without public IP or port forwarding. The Leader dials outbound reverse connections to public cloud VMs (Hetzner, AWS, Azure) or home labs, establishing a persistent bidirectional control plane without exposing the private Leader to the Internet.
- Topology 4 — Public Cloud SaaS Leader + Distributed Private Spokes: Central cloud-hosted Stigix controller with private enterprise branches connecting in over reverse tunnels.
For architectural diagrams, step-by-step setup, and downloadable PDF guide, see docs/PRIVATE_DEPLOYMENT_TOPOLOGIES.md.
In many enterprise labs, the private Leader cannot be assigned a public IP or exposed to the Internet. Yet operators need to benchmark traffic against public cloud providers (such as Hetzner or AWS) to test SASE egress.
With Leader Outbound Reverse Dialing:
- The operator adds the Cloud VM target in Settings → Targets on the Leader.
- The private Leader initiates an outbound HTTP/WebSocket session to the Cloud VM's
/fleet-tunnelendpoint. - The Cloud VM authenticates the connection and begins pushing its live telemetry and pulling configuration bundles back over the persistent WebSocket session.
- The Leader remains completely hidden behind corporate firewalls with zero inbound ports open to the public Internet.
Branch nodes (e.g. BR1, BR2, BR5, BR8) behind egress-only firewalls or cellular 4G/5G CGNAT establish outbound WebSocket sessions to the Leader's /fleet-tunnel namespace:
- Zero Inbound Ports on Spokes: No firewall rules or port forwarding required on branch routers.
- Multiplexed Control & Provisioning: The Leader uses the existing outbound socket to proxy API calls, trigger tests, and push global provisioning updates.
- Ultra-Low Overhead: When idle, heartbeat and telemetry polling generate less than 0.5 kbps per node (~50 bytes/second).
- Automatic Fallback: Direct HTTP is automatically selected whenever nodes share a direct LAN / MPLS route.
Stigix uses minimal standard ports across all communication channels:
- Port 8080 (TCP): Control plane (Web Dashboard, REST API, Fleet Gateway, and WebSocket Reverse Tunnel
/fleet-tunnel). - Port 9000 (TCP / UDP): Data plane (XFR high-speed bandwidth testing & Voice Echo RTP simulation).
- Port 9100 (TCP): Optional Custom TCP inter-site application listener.
Port direction summary by topology:
- Topology 1 (LAN): Bidirectional ports 8080 & 9000 between all nodes.
- Topology 2 (NAT Spokes): Leader requires inbound port 8080 & 9000 from Spokes. Spokes require outbound only.
- Topology 3 (Zero-Inbound Leader): Cloud Peer requires inbound port 8080 & 9000. DC Leader requires outbound only (zero inbound ports on Leader).
- Topology 4 (Cloud SaaS Leader): Cloud Leader requires inbound 8080 & 9000. All branch spokes require outbound only.
Yes! Starting in v2.0.112, the Stigix Fleet Gateway features native WebSocket Chunked Stream Forwarding (gateway:stream:*):
- Real-Time SSE Streaming: Server-Sent Events (SSE) from remote peers — such as 1-second Speedtest throughput updates, active latency tracking, and live API logs — are streamed chunk-by-chunk through the persistent reverse tunnel.
- Sub-Second Graph Animation: The dashboard graph animates smoothly in real time exactly as if connected directly via LAN HTTP.
- Zero-Downtime Abort: Closing the tab or stopping the test sends an immediate abort event (
gateway:stream:abort) across the tunnel to terminate local processes on the spoke.
Stigix incorporates multi-tier resiliency and self-healing mechanisms:
- Persistent Reconnect with Exponential Backoff: If a WAN link or Internet connection drops, the Socket.IO client automatically retries connection every 5–20 seconds.
- 15-Second Heartbeats: Continuous liveness pings detect stale sockets and clean up half-open TCP sessions within 30 seconds.
- Local State Retention: In-flight test suites and promoted targets remain cached in local memory, surviving temporary controller link cuts without service interruption.
- Automatic Cloudflare Fallback: If the private Leader becomes unreachable, peers automatically fall back to the global Cloudflare registry within 60 seconds.